Introduction
In the last section we discussed connectomes - full diagrams describing how every neuron connects to every other neuron in an animal.
Glial cells
First, let’s point out something we’ve not mentioned yet - neurons may only be some of the story, as there are other cells in the brain too.
These are known as glial cells. In humans it’s estimated that the ratio of neurons to glial cells is roughly 60 to 40 and there are many different types of glial cells.
So what are they for?
Historically, it was thought they mainly played supporting roles. For example:
- Oligodendrocytes, shown in purple, form the fatty myelin sheaths around axons.
- Microglia, shown in blue, act as immune cells by removing dead cells and responding to pathogens.
But it’s increasingly thought that glial may play computational roles too. For example Astrocytes, which have star shapes, shown in green, both detect and respond to neural activity through multiple mechanisms like:
- Modulating the concentration of potassium around neurons
- Or even using their own neurotransmitters known as glial-transmitters.
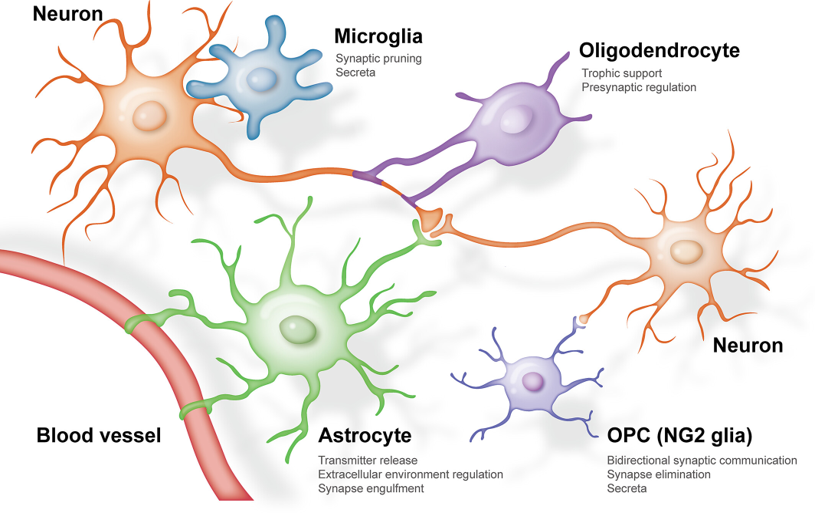
Figure 1:Diagram illustrating the different types of glial cells. From Liu et al. (2023).
Human brain
Putting it all together, the human brain is thought to be composed of roughly 86 billion neurons, 50 billion glial cells and synapses - though this is hard to estimate.
At a more macro level, these figures, show the gross structure of the brain from a lateral view, as if you’re looking at someone from their left hand side.
The diagram on the left shows the brain’s outer surface and there are a few interesting features to note.
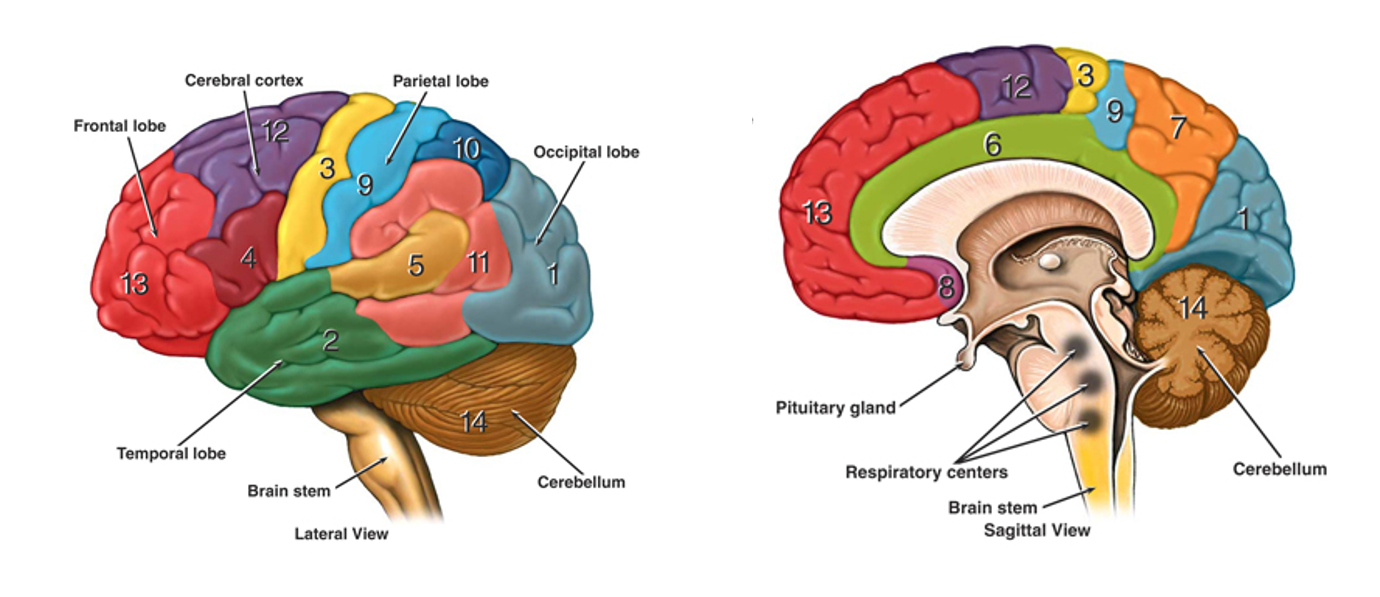
Figure 2:Lateral view and sagittal views showing the gross structure of the human brain.
The outermost layer, known as the cortex, has a folded structure which increases its surface area relative to brain volume.
Folds are known as gyri and depressions are known sulci.
Larger depressions or fissures divide the brain into 4 major lobes.
- Frontal
- Temporal
- Parietal
- Occipital
The cerebellum, which we discussed at a micro level in week 2, sits at the back. Then at the base there is the brain stem, which connects the brain to the spinal cord.
What you can’t see in the diagram is that the brain is divided, left and right, into 2 hemispheres. They are largely symmetric and connected across the midline by a structure known as the corpus callosum.
Finally the diagram on the right shows a sagittal section, as if we’ve divided the 2 hemispheres and then removed the left.
Taking a different view, if we now imagine looking at someone front on and then taking a perpendicular slice through the brain we get a coronal section, which would look something like this.
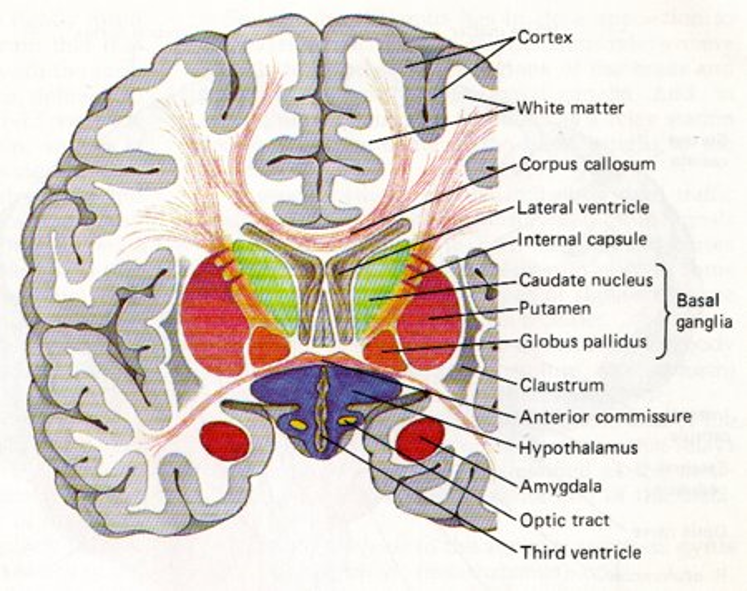
Figure 3:Diagram showing a coronal section of the human brain.
The outermost layer, the cortex, is also referred to as gray matter as it mainly contains dendrites, soma, synapses etc which are Unmyelinated. However, below there are tracks where myelinated axons tend to travel, which are known as white matter. For example the corpus callosum, which we just mentioned.
Deeper in the brain, there are then various nuclei which are clusters of neurons.
The nervous system
Zooming out one last time, the entire nervous system is composed of two parts:
- The central nervous system - which consists of the brain and the spinal cord.
- And the peripheral nervous system - which carries information in two directions.
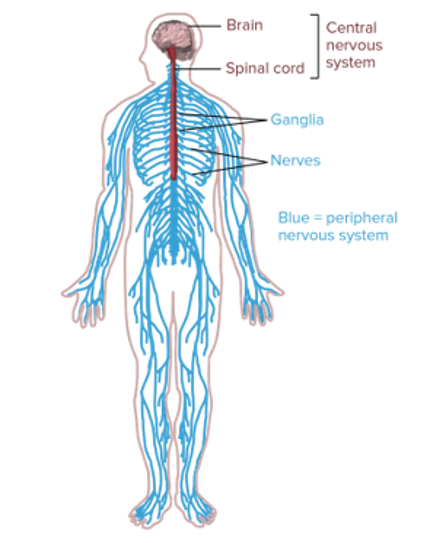
Figure 4:Diagram of the entire human nervous system.
Sensory neurons convert external stimuli to spikes and then carry these signals to the spinal cord and the brain. For example, neurons which sense pressure, have specialised channels known as piezo channels, which physically deform in response to pressure. This allows ions to flow into the neuron and then trigger action potentials.
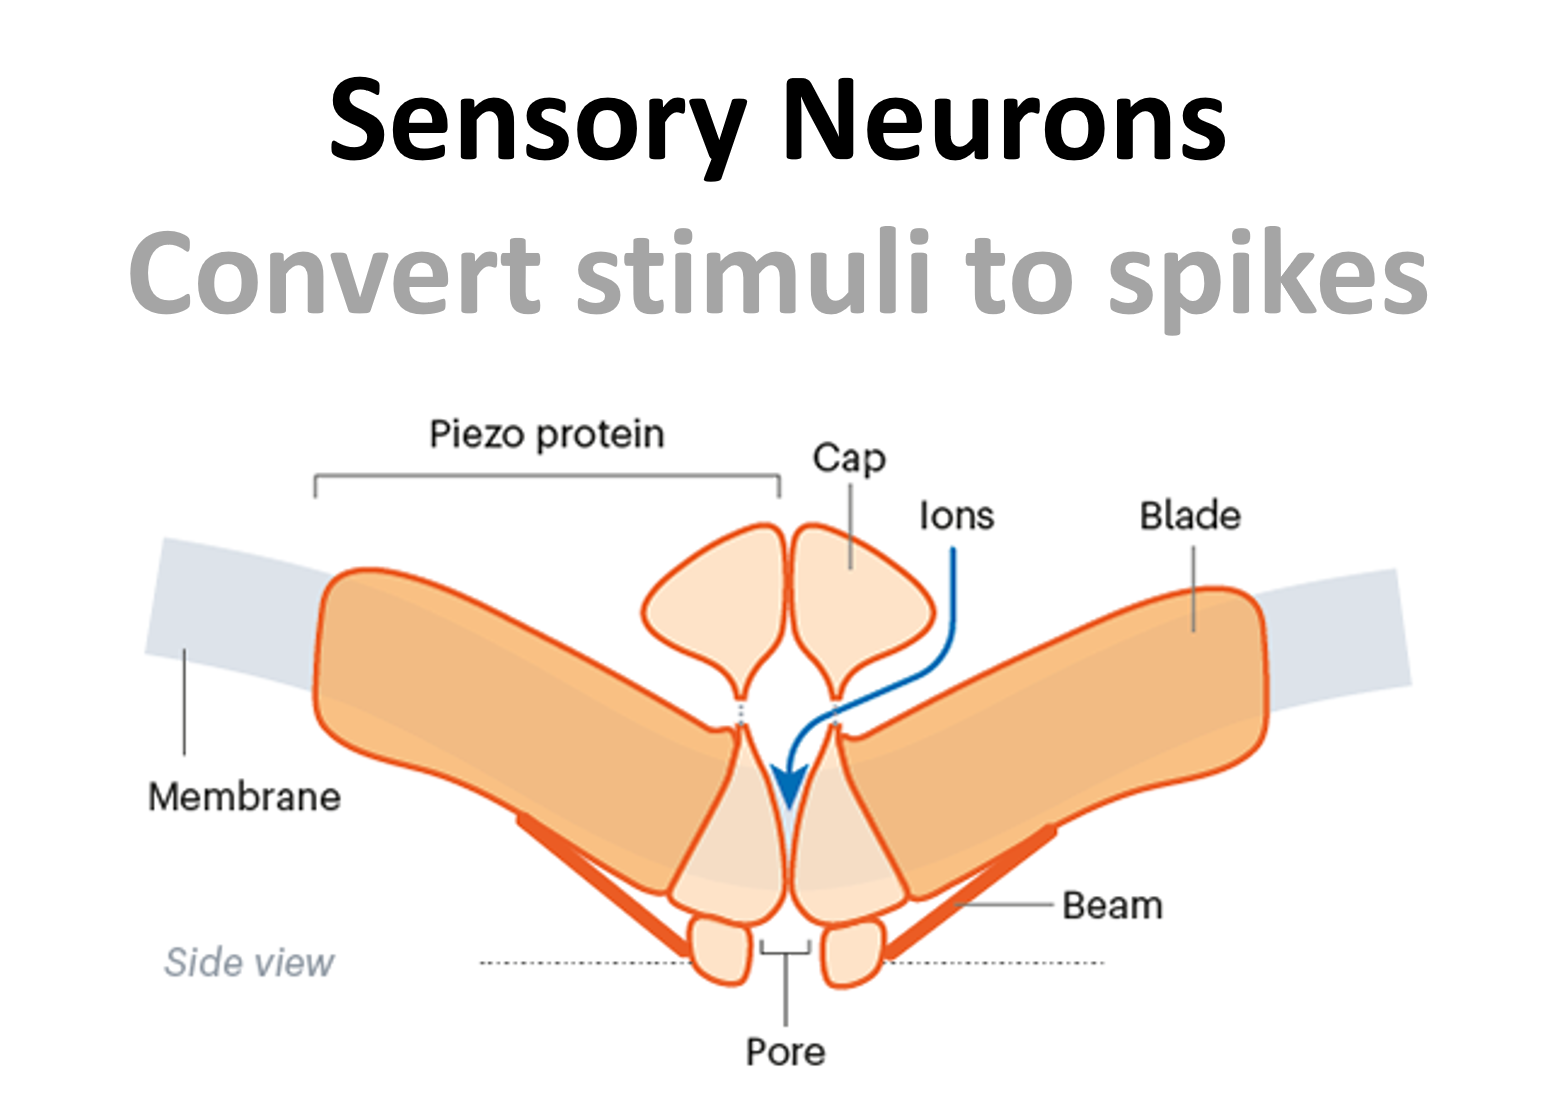
Figure 5:Diagram showing a piezo channel.
In the other direction, motor neurons synapse with muscles, at what is known as the neuromuscular junction, where they use a special neurotransmiter (acetylcholine) to link neural activity to movement.
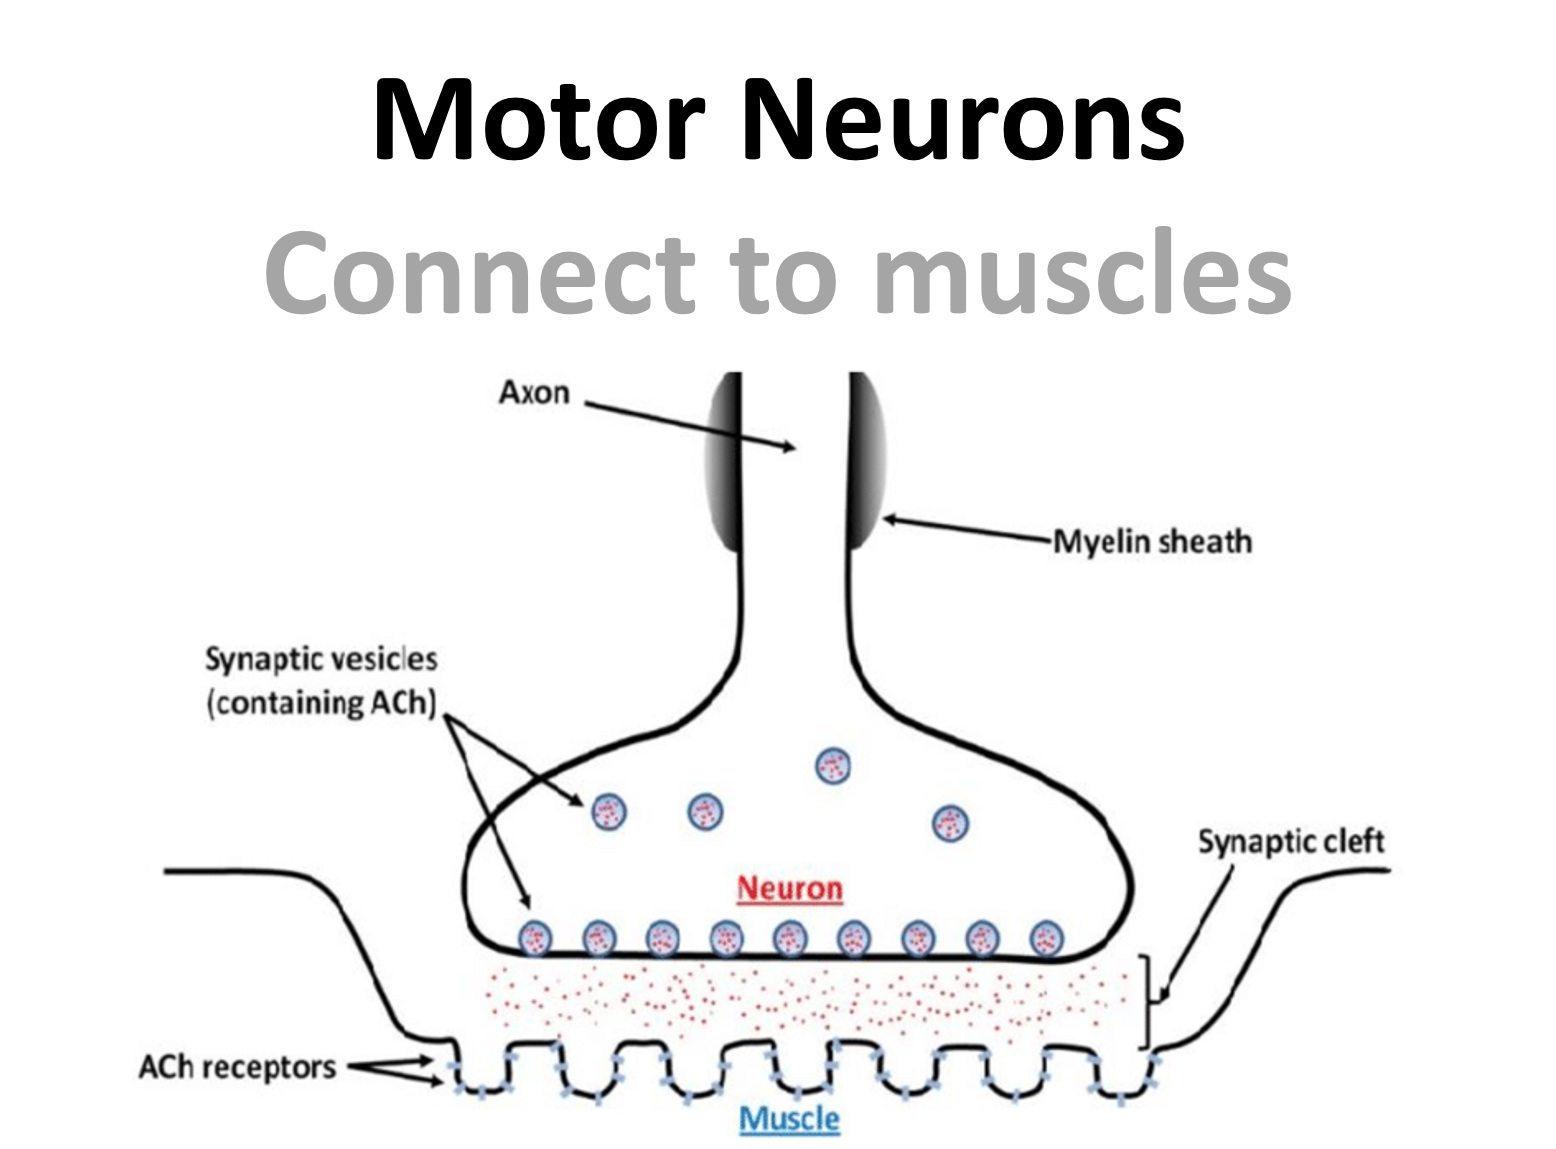
Figure 6:Diagram showing the neuromuscular junction.
Localisation of function
Going back to the brain, we often think about specific functions as being localised to specific brain areas.
For example, we call part of the occipital lobe the visual cortex, and part of the temporal lobe the auditory cortex.
We have 3 types of data that seem to support localisation of function:
- When we observe neural activity in response to stimuli or during tasks we see that neurons with similar responses tend to be co-located. For example, in this study human participants were asked to read words presented to a single eye while their brain activity was imaged using a technique known as FMRI. The top row of this figure shows left and right views of the brain with the inferred amount of neural activity overlaid in red in response to words presented to either the left or the right eye. So you can see that this task activates some localised areas.
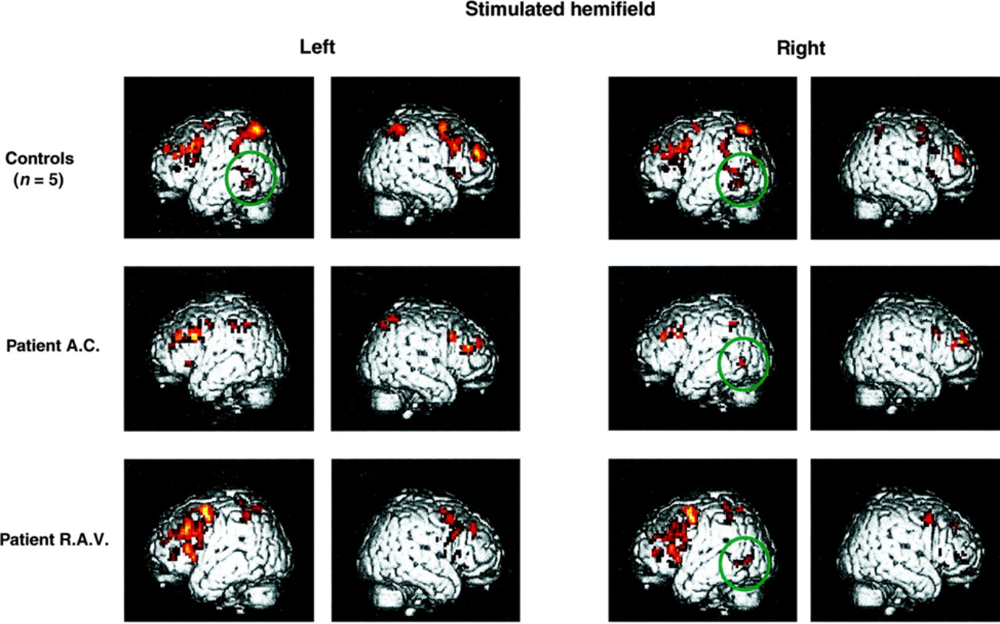
Figure 7:A study of human brain activity (using FMRI) in both controls and patients. From Cohen et al. (2000).
- If we manipulate specific parts of the brain, we see specific differences in behavior. Though, while we perform these manipulations in animal models ourselves, in humans they usually result from accidents, disease processes or surgical interventions. For example, in the same paper, the authors also studied two patients who had damaged part of their corpus callosum. These patients lost relatively specific function and in this study, they were unable to read words aloud that were presented in the left visual field. The 2 rows of patient imaging data show how their neural activity differs from controls, and so reflects this behavioral difference. Specifically in control subjects, a region was activated irrespective of the simulated hemi-field, which is shown by the green circle, but in patients it was only activated by right field stimulation.
- If we look at the brain structure we see that connectivity tends to be sparse and modular, which could seem to imply that individual modules may perform specialised functions. But is that necessarily the case? In other words, will a network with a modular structure necessarily modularise function?
Structural vs functional specialisation
Béna & Goodman (2021) use a really neat setup to explore this question. As a model they use artificial neural networks composed of modules where each module is a recurrent neural network with dense connections internally but sparse connections to other modules.
As a task, they input pairs of digits and train networks to output a parity based label, which means that networks could solve the task by using a modular solution, where each module would learn to recognise its own input digit. To measure functional specialisation they use three different metrics.
One of which is a manipulation based metric, where they silence each module in turn and see how that affects the network’s ability to recognise each digit. So a module would be defined as specialised if silencing it decreases the classification accuracy for one digit but not the other. With that setup, they then vary the amount of connectivity between the modules labelled as on the left diagram and measure functional specialisation.
One of their main results is shown on the right figure, where the x-axis is the amount of inter module connectivity , and the y-axis is the level of functional specialisation. What you can see is that when is low, so inter module connectivity is sparse, functional specialisation is high. But as increases, specialisation decreases very rapidly.
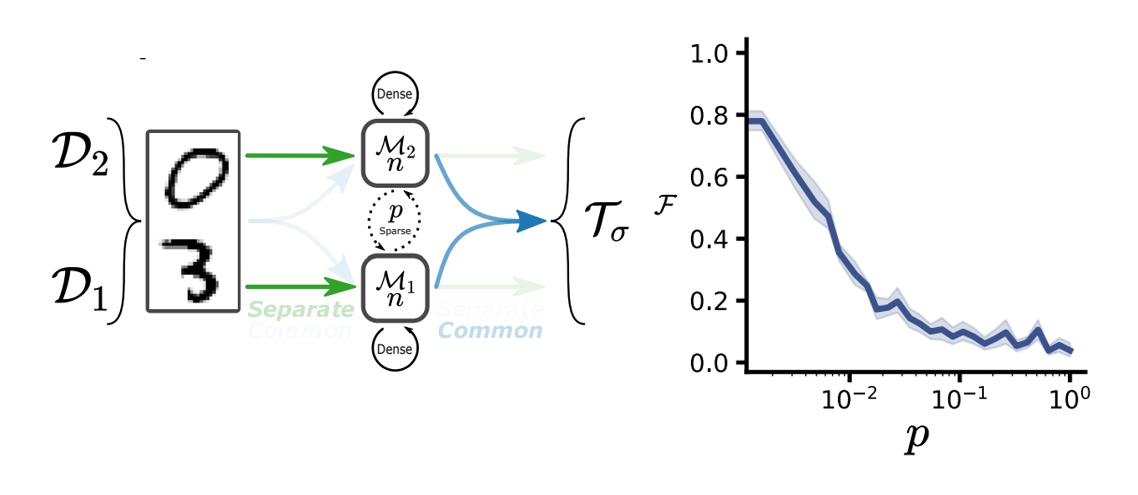
Figure 8:Setup and results from Béna & Goodman (2021).
This suggests that only networks with extremely sparse inter module connections become functionally specialised, and together with other evidence, this paper adds to a growing picture that function in the brain may be less localised than previously thought.
- Liu, Y., Shen, X., Zhang, Y., Zheng, X., Cepeda, C., Wang, Y., Duan, S., & Tong, X. (2023). Interactions of glial cells with neuronal synapses, from astrocytes to microglia and oligodendrocyte lineage cells. Glia, 71(6), 1383–1401. 10.1002/glia.24343
- Cohen, L., Dehaene, S., Naccache, L., Lehéricy, S., Dehaene-Lambertz, G., Hénaff, M.-A., & Michel, F. (2000). The visual word form area. Brain, 123(2), 291–307. 10.1093/brain/123.2.291
- Béna, G., & Goodman, D. F. M. (2021). Dynamics of specialization in neural modules under resource constraints. arXiv. 10.48550/ARXIV.2106.02626