Introduction
Last week we covered how neurons synapse together to form networks, and we looked at some example networks like a ring attractor in the fruit-fly brain.
Now, we’re going to zoom out and consider what whole-brains look like, which brings us to the connectome: the concept of having a full diagram describing how every neuron connects to every other neuron.
To date only four organisms have a full connectome, the first of which was the roundworm C. elegans
C. elegans connectome
The C. elegans connectome was first completed in White et al. (1997) and then updated in Cook et al. (2019).
C. elegans are only around 1mm long, but still to obtain the connectome, researchers had to:
- Slice the samples into very thin sections, around 50nm thick
- View each under a microscope
- And then trace each neuron’s connections through the slices by hand.
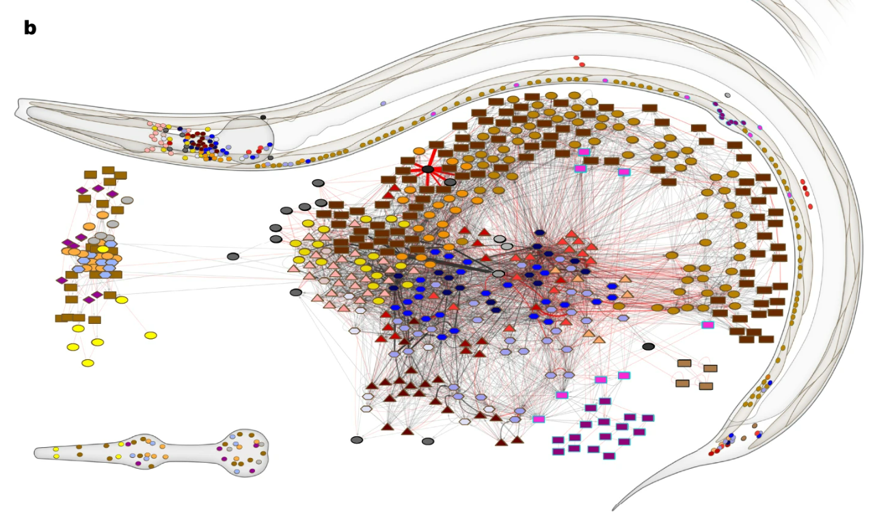
Once complete they found the connectivity pattern shown here, which has just 302 neurons and around 7,000 synapses.

Figure 1:A diagram showing the C. elegans connectome from Cook et al. (2019).
From this architecture, we learn the following:
- About 80% of synapses are chemical, and the rest are gap junctions.
- The connectivity is sparse with only around 3% of all possible connections present.
- Neurons generally have dense local connections, but sparse long-range connections, meaning the network has a modular structure.
- From sensory inputs to motor outputs the network is at most around 4 layers deep, so is relatively shallow.
Though something to keep in mind is that while this network may seem simple, especially compared to a machine learning model, it allows the worm to do everything from responding to sensory inputs, to foraging for food in it’s environment, and mating to produce offspring, so don’t underestimate the complexity you can get from even a relatively small biological network.
Okay so, this connectome was generated by combining data from multiple animals of around the same age, so it gives us a representative, static view of brain structure.
But the brain is continuously changing as we learn and age, so how is that reflected in the connectome?
Different ages
To address that question, Witvliet et al. (2021) reconstructed the connectomes of 8 worms, each of which was a different age, and then compared these.
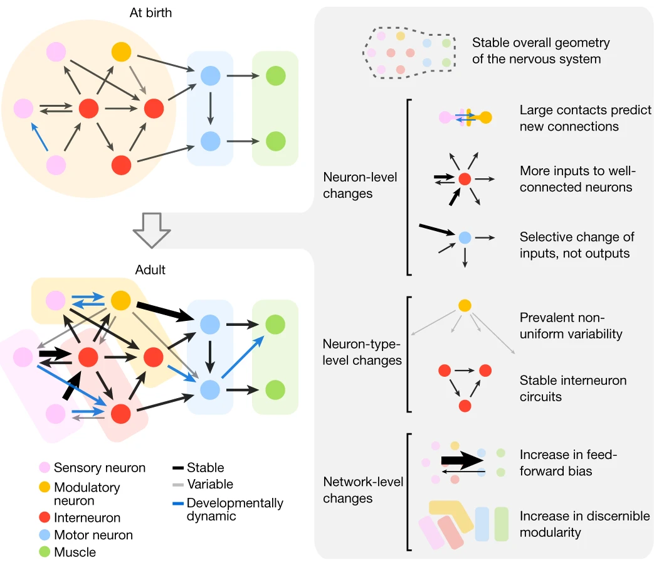
They found that from birth to adulthood, there is a five-fold increase in the number of synapses, though these changes are not uniform and instead follow several patterns, which are summarized in this figure.

Figure 2:How the C. elegans connectome changes with age. From Witvliet et al. (2021).
Just to highlight three:
- New synapses tend to be added in the feedforward direction, from sensory inputs to motor outputs, so the network becomes increasingly feed-forward over time.
- If you group neurons with similar connectivity patterns into modules or sub-networks, then you observe that the network becomes increasingly modular with age.
- Even though these worms were genetically identical, each worm had connections that were not found in other worms, which shows that experience also shapes structure of neural circuits.
Okay, moving beyond C. elegans, other models are beginning to have their connectomes mapped out too, like the fruit-fly Drosophila.
Drosophila connectome
For example, Winding et al. (2023) reconstructed the fruit-fly larva, or maggot, connectome.
They found that even going from a small worm to a maggot, there are already 10 times as many neurons (3016) and almost 80 times as many synapses (548000).
So what can we learn from this connectome?
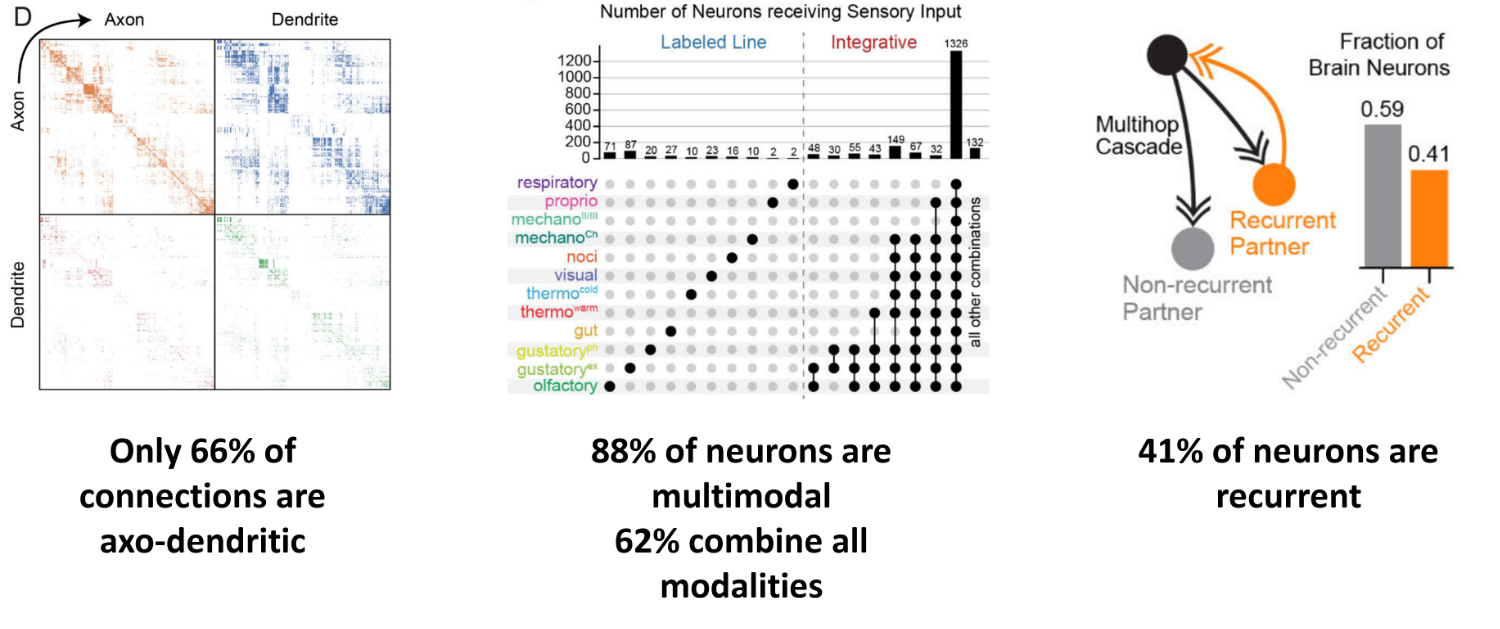
Well one interesting feature is that if you define the direction of each synapse, so which neuron is pre and which is post-synaptic, then contrary to what we usually assume in the field and have taught you so far, only 66% of connections are between the axon of one neuron and the dendrite of another.
The rest are “non-cannonical”, and you observe all connection types - axon to axon, axon to dendrite, dendrite to axon, and dentrite to dentrite. This means that the overall connectome is the result of 4 distinct neuron to neuron matrices as shown on the leftmost figure.
Another interesting feature is that almost all neurons are multimodal. So if you start from the larva’s sensory neurons - which detect inputs like taste, temperature and touch, and then use a signal cascade algorithm, to propagate signals through a model of the network, you find that only 12% of neurons receive input from a single modality. Shown on the left of the middle figure.
The other 88% receive inputs from different combinations of modalities which are shown on the right of the middle figure. And, somewhat surprisingly, 62% of neurons receive inputs from all 12 modalities!
Finally, the authors estimate that 41% of neurons are recurrent polysynaptically. i.e. neuron A connects to B, B to C etc, and then eventually there is a connection back to A. The rightmost figure illustrates this with a simple A-B-A connection, in orange, but the bar chart considers loops with up to 5 synapses.

Figure 3:Features learnt from Drosophila connectome. Adapted from Winding et al. (2023).
Okay stepping back a bit, we may expect that animals with more complex behaviors, like us, may have very similar connectomes to the fly and the worm, but simply scaled up. Or we may expect additional features.
Either way, it would be great if we could obtain larger connectomes.
The problem is that brain volume scales very rapidly.
Scaling
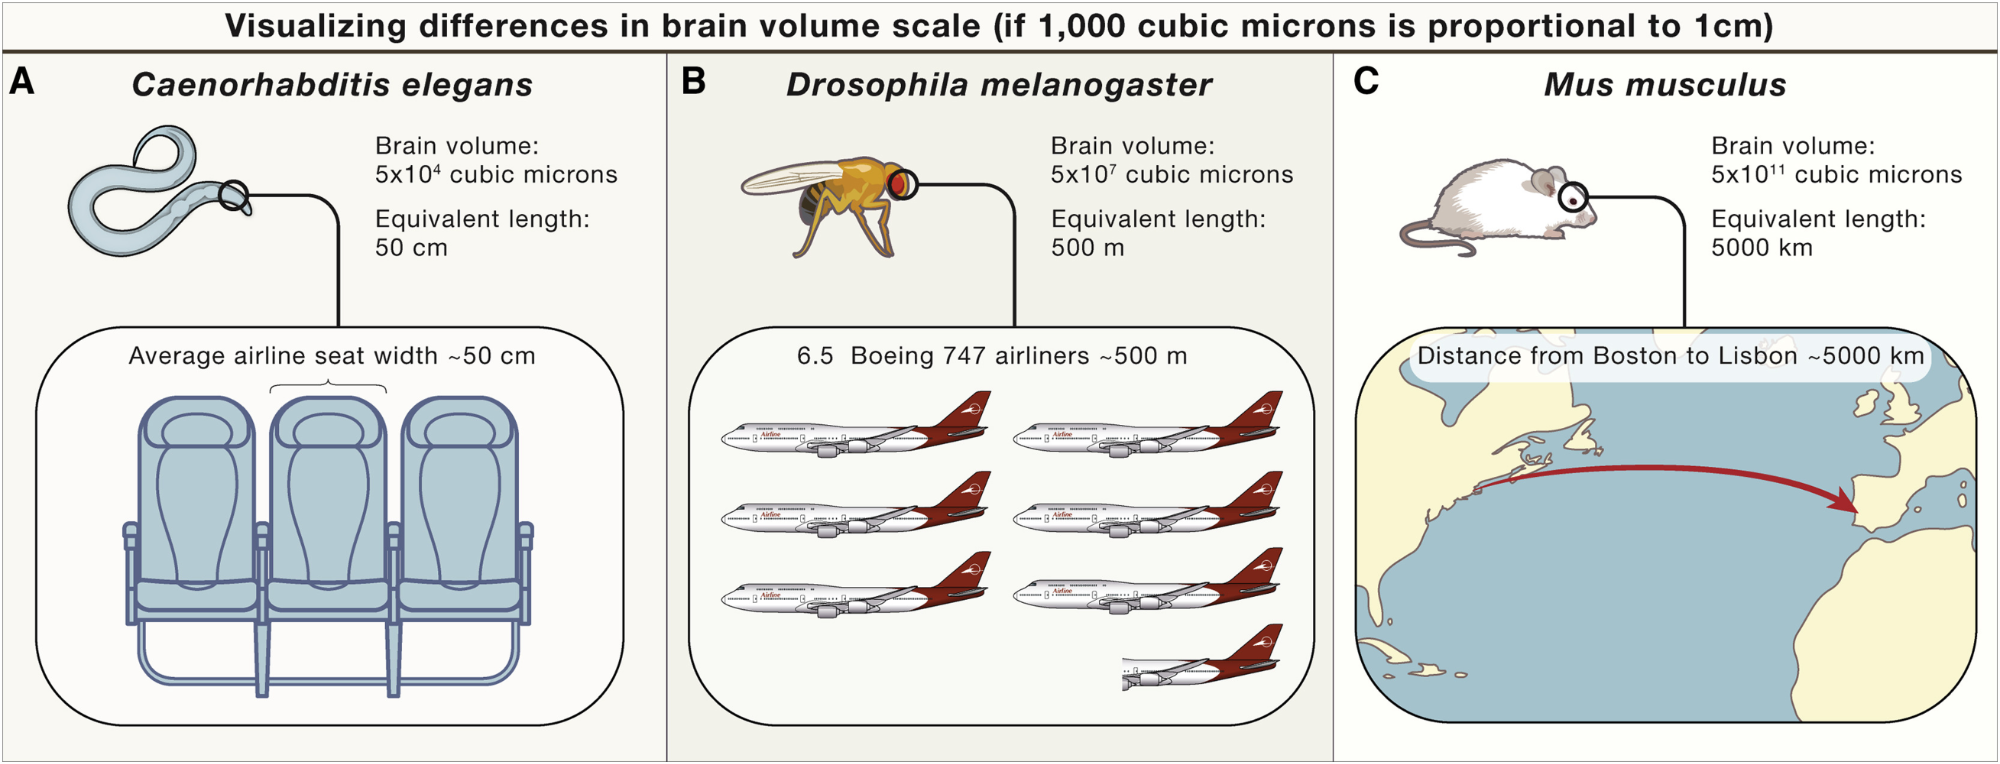
For example, going from a worm to a mouse is a 10-million fold increase in brain volume.
To visualize that, if 1,000 cubic microns of brain volume is proportional to a 1cm linear distance: Then the worm brain, which we’ve discussed, is equivalent to the width of a seat on an airplane. The adult fruit-fly brain, is equivalent to the length of 6.5 airplanes. And the mouse brain, is equivalent to the distance between Boston and Lisbon.

Figure 4:An illustration of how rapidly brain volume scales. From Abbott et al. (2020).
So clearly obtaining larger connectomes, presents huge challenges in terms of data acquisition, storage and analysis.
- White, J. G., Southgate, E., Thomson, J. N., & Brenner, S. (1997). The structure of the nervous system of the nematode Caenorhabditis elegans. Philosophical Transactions of the Royal Society of London. B, Biological Sciences, 314(1165), 1–340. 10.1098/rstb.1986.0056
- Cook, S. J., Jarrell, T. A., Brittin, C. A., Wang, Y., Bloniarz, A. E., Yakovlev, M. A., Nguyen, K. C. Q., Tang, L. T.-H., Bayer, E. A., Duerr, J. S., Bülow, H. E., Hobert, O., Hall, D. H., & Emmons, S. W. (2019). Whole-animal connectomes of both Caenorhabditis elegans sexes. Nature, 571(7763), 63–71. 10.1038/s41586-019-1352-7
- Witvliet, D., Mulcahy, B., Mitchell, J. K., Meirovitch, Y., Berger, D. R., Wu, Y., Liu, Y., Koh, W. X., Parvathala, R., Holmyard, D., Schalek, R. L., Shavit, N., Chisholm, A. D., Lichtman, J. W., Samuel, A. D. T., & Zhen, M. (2021). Connectomes across development reveal principles of brain maturation. Nature, 596(7871), 257–261. 10.1038/s41586-021-03778-8
- Winding, M., Pedigo, B. D., Barnes, C. L., Patsolic, H. G., Park, Y., Kazimiers, T., Fushiki, A., Andrade, I. V., Khandelwal, A., Valdes-Aleman, J., Li, F., Randel, N., Barsotti, E., Correia, A., Fetter, R. D., Hartenstein, V., Priebe, C. E., Vogelstein, J. T., Cardona, A., & Zlatic, M. (2023). The connectome of an insect brain. Science, 379(6636). 10.1126/science.add9330
- Abbott, L. F., Bock, D. D., Callaway, E. M., Denk, W., Dulac, C., Fairhall, A. L., Fiete, I., Harris, K. M., Helmstaedter, M., Jain, V., Kasthuri, N., LeCun, Y., Lichtman, J. W., Littlewood, P. B., Luo, L., Maunsell, J. H. R., Reid, R. C., Rosen, B. R., Rubin, G. M., … Van Essen, D. C. (2020). The Mind of a Mouse. Cell, 182(6), 1372–1376. 10.1016/j.cell.2020.08.010