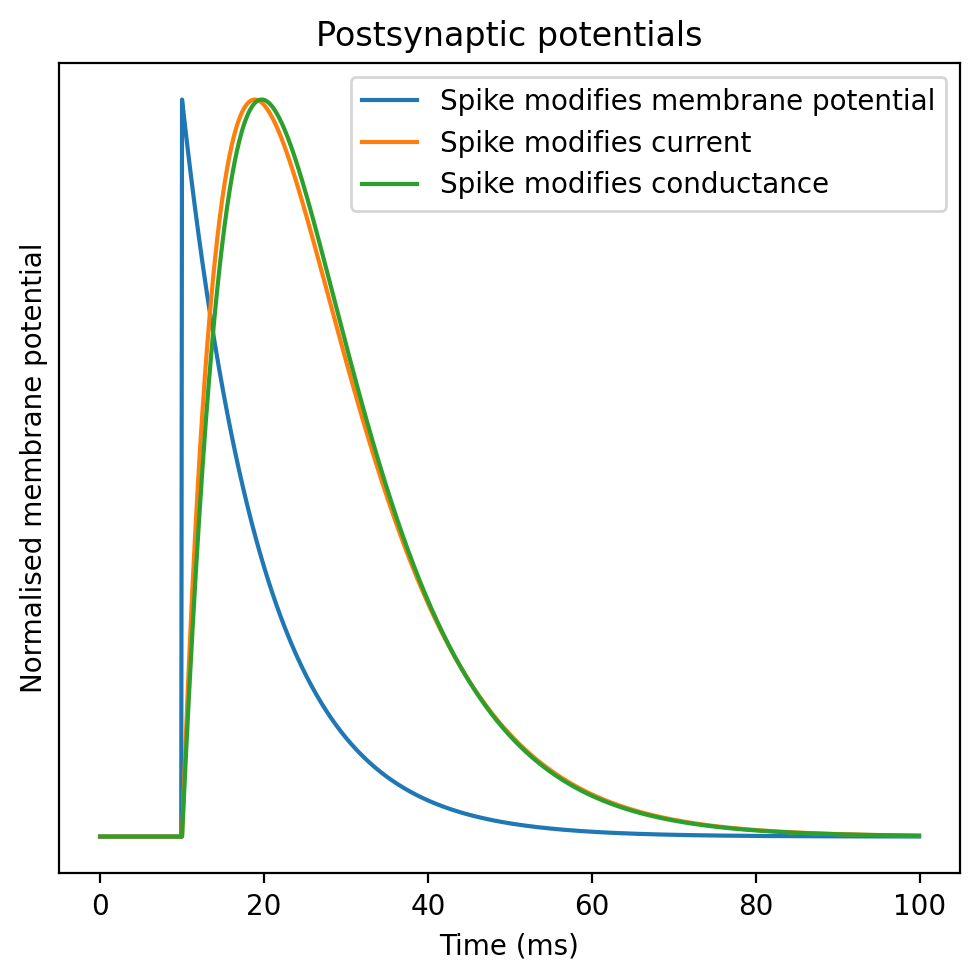
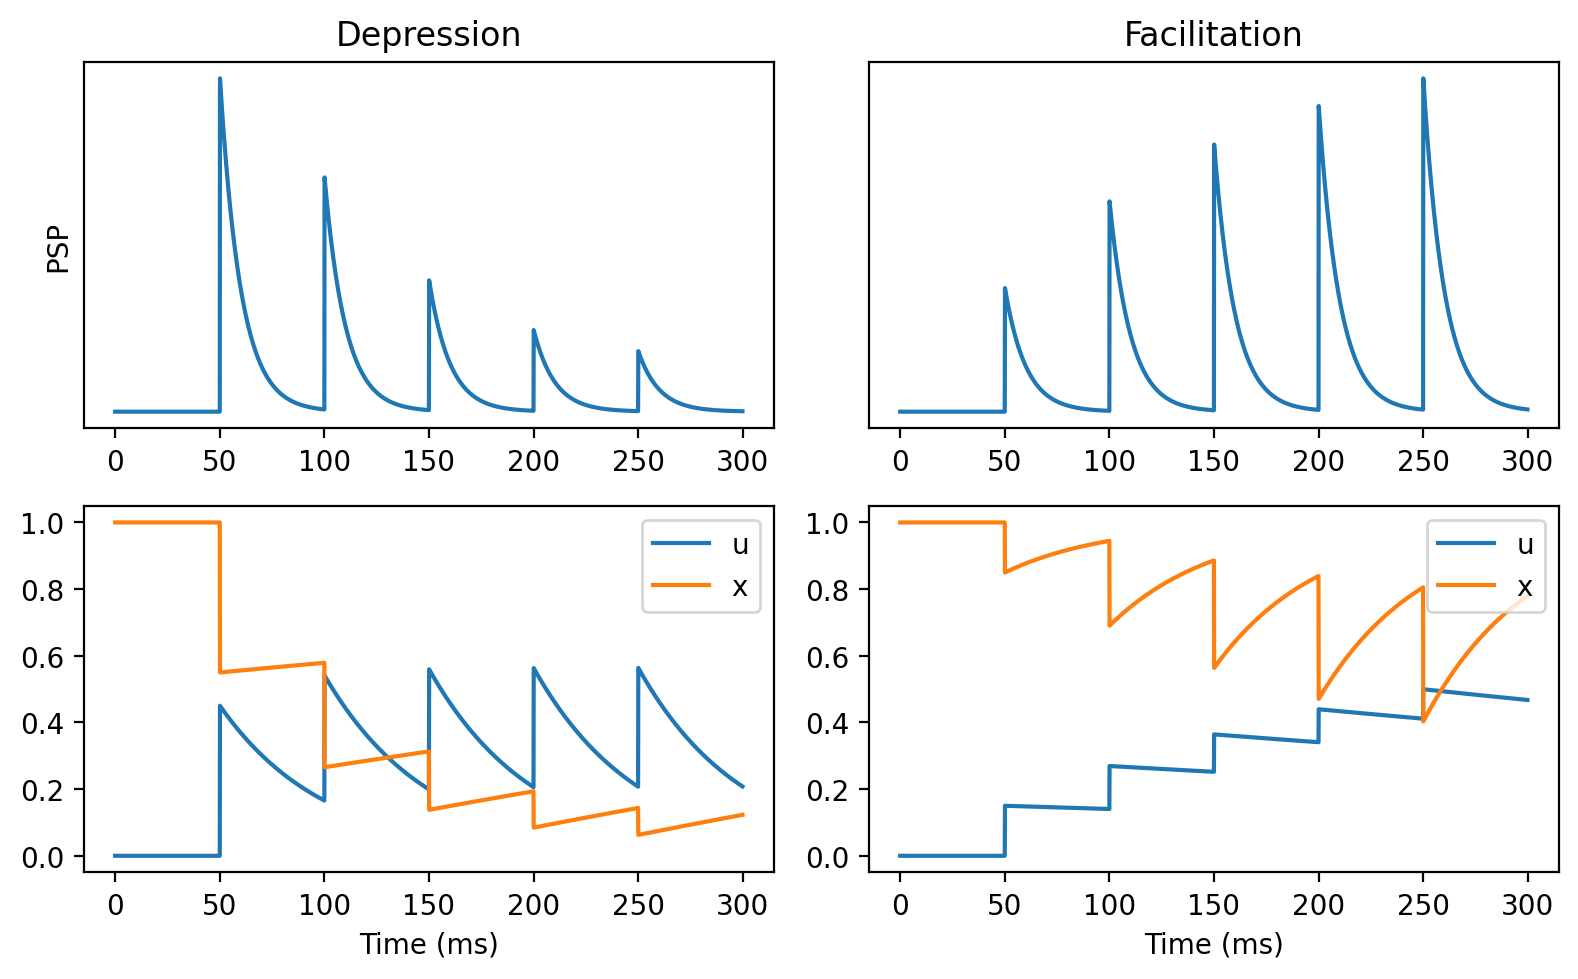
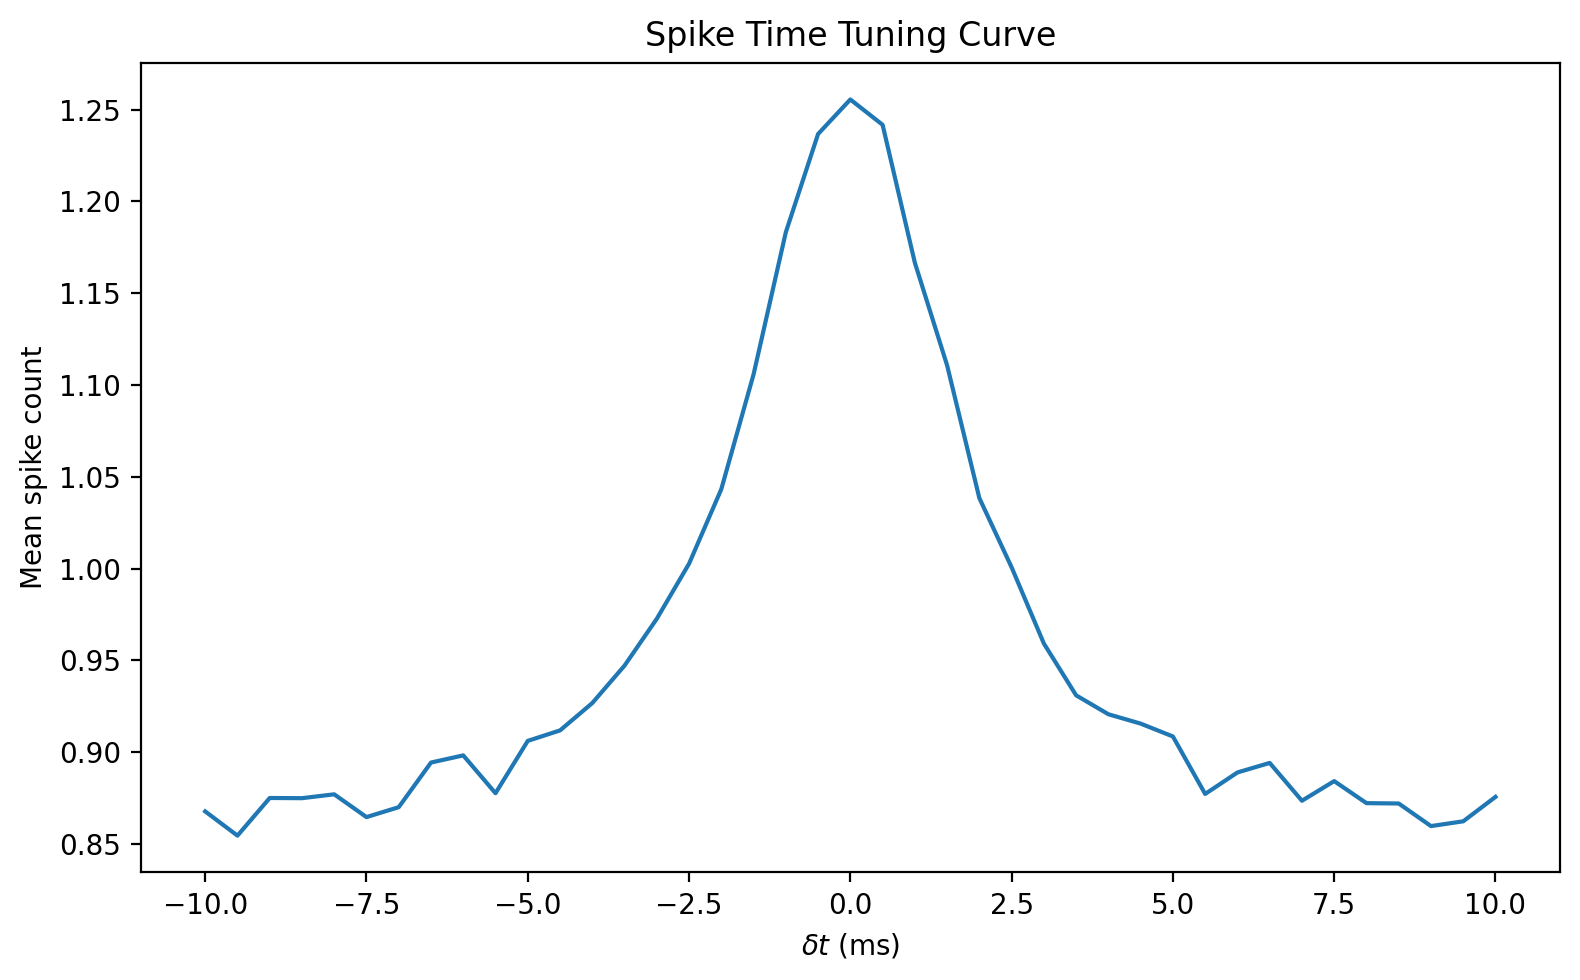
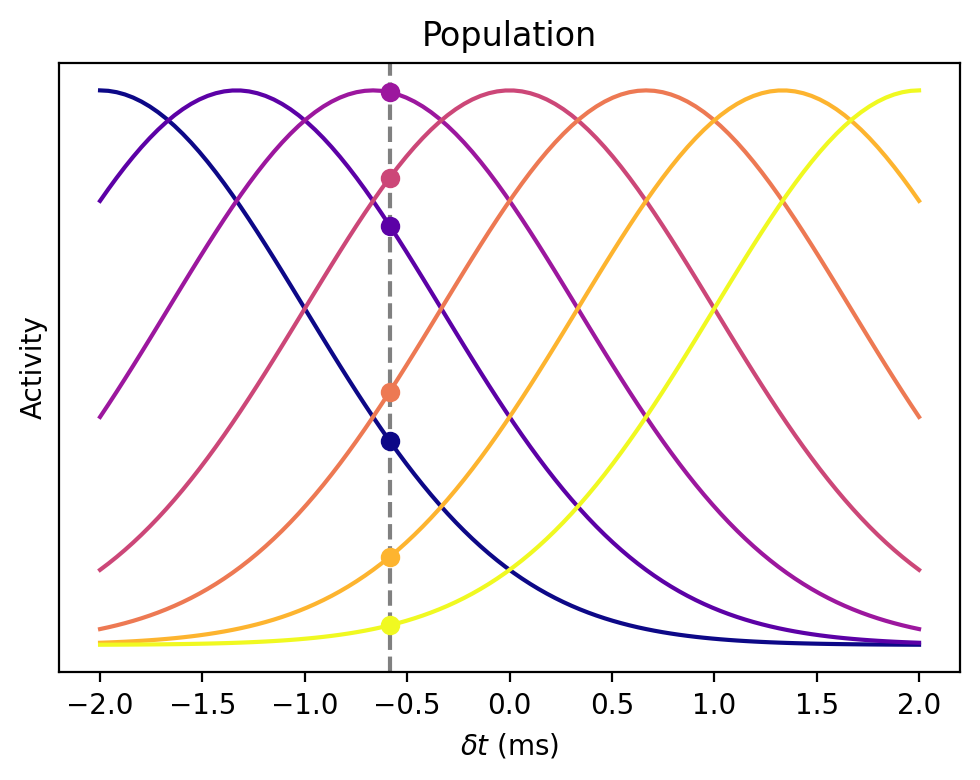
The code below generates the figures used in the notebooks, and might be useful to explore these ideas further.
It makes use of the Brian spiking neural network simulator package. Feel free to have a play with this and explore its documentation, including excellent tutorials.
!pip install brian2
import os
from brian2 import *
prefs.codegen.target = 'numpy'

# Suppress warnings in Brian2
import logging
logging.getLogger('brian2').setLevel(logging.ERROR)
Requirement already satisfied: brian2 in d:\miniconda3\envs\neuro4ml\lib\site-packages (2.5.4)
Requirement already satisfied: numpy>=1.21 in d:\miniconda3\envs\neuro4ml\lib\site-packages (from brian2) (1.26.0)
Requirement already satisfied: cython>=0.29 in d:\miniconda3\envs\neuro4ml\lib\site-packages (from brian2) (3.0.2)
Requirement already satisfied: sympy>=1.2 in d:\miniconda3\envs\neuro4ml\lib\site-packages (from brian2) (1.12)
Requirement already satisfied: pyparsing in c:\users\dgoodman\appdata\roaming\python\python39\site-packages (from brian2) (2.4.7)
Requirement already satisfied: jinja2>=2.7 in c:\users\dgoodman\appdata\roaming\python\python39\site-packages (from brian2) (2.11.3)
Requirement already satisfied: setuptools>=61 in d:\miniconda3\envs\neuro4ml\lib\site-packages (from brian2) (68.2.2)
Requirement already satisfied: packaging in d:\miniconda3\envs\neuro4ml\lib\site-packages (from brian2) (23.2)
Requirement already satisfied: py-cpuinfo in d:\miniconda3\envs\neuro4ml\lib\site-packages (from brian2) (9.0.0)
Requirement already satisfied: MarkupSafe>=0.23 in c:\users\dgoodman\appdata\roaming\python\python39\site-packages (from jinja2>=2.7->brian2) (1.1.1)
Requirement already satisfied: mpmath>=0.19 in d:\miniconda3\envs\neuro4ml\lib\site-packages (from sympy>=1.2->brian2) (1.3.0)
C:\Users\dgoodman\AppData\Roaming\Python\Python39\site-packages\scipy\__init__.py:138: UserWarning: A NumPy version >=1.16.5 and <1.23.0 is required for this version of SciPy (detected version 1.26.0)
  warnings.warn(f"A NumPy version >={np_minversion} and <{np_maxversion} is required for this version of "
Level of abstraction
start_scope()

tau = 10*ms
taux = 8*ms
taug = 8*ms
eqs = '''
dv/dt=-v/tau:1
du/dt=((taux/tau)**(-tau/(tau-taux))*x-u)/tau:1
dx/dt=-x/taux:1
dz/dt=(I-z)/tau:1
I=g*(z+1):1
dg/dt=-g/taug:1
'''
G = NeuronGroup(1, eqs, method='euler')
M = StateMonitor(G, ('v', 'u', 'z'), record=True)
run(10*ms)
G.v = 1
G.x = 1
G.g = 1
run(90*ms)
def normed(x):
    return x/amax(x)
figure(figsize=(5, 5), dpi=200)
plot(M.t/ms, M.v[0], label='Spike modifies membrane potential')
plot(M.t/ms, normed(M.u[0]), label='Spike modifies current')
plot(M.t/ms, normed(M.z[0]), label='Spike modifies conductance')
xlabel('Time (ms)')
ylabel('Normalised membrane potential')
yticks([])
legend(loc='upper right')
title('Postsynaptic potentials')
tight_layout();
Postsynaptic potential forms
start_scope()

tau = 10*ms
tau2 = 2*ms
eqs = '''
dv/dt=-v/tau:1
du/dt=(x-u)/tau:1
dx/dt=-x/tau:1
dz/dt=(I-z)/tau:1
dI/dt=-I/tau2:1
'''
G = NeuronGroup(1, eqs, method='euler')
M = StateMonitor(G, ('v', 'u', 'z'), record=True)
run(5*ms)
G.v = 1
G.x = 1
G.I = 1
run(45*ms)
def normed(x):
    return x/amax(x)
figure(figsize=(7, 2), dpi=200)
plot(M.t/ms, normed(M.v[0]), label='Exponential')
plot(M.t/ms, normed(M.u[0]), label='Alpha')
plot(M.t/ms, normed(M.z[0]), label='Biexponential')
xlabel('Time (ms)')
yticks([])
legend(loc='upper right')
tight_layout();
Short term synaptic plasticity
start_scope()
def runit(offset, tau, tauf, taud, U):
    eqs = '''
    dv/dt = -v/tau : 1
    du/dt = -u/tauf : 1
    dx/dt = (1-x)/taud : 1
    '''
    H = SpikeGeneratorGroup(1, [0]*5, np.arange(1, 6)*50*ms)
    G = NeuronGroup(1, eqs, method='euler')
    G.x = 1
    S = Synapses(H, G, on_pre='u += U*(1-u); v += u*x; x -= u*x;')
    S.connect(p=1)
    M = StateMonitor(G, ('v', 'u', 'x'), record=True)
    run(300*ms)
    subplot(2, 2, 1+offset)
    if offset:
        title('Facilitation')
    else:
        title('Depression')
    plot(M.t/ms, M.v[0])
    yticks([])
    if offset==0:
        ylabel('PSP')
    subplot(2, 2, 3+offset)
    plot(M.t/ms, M.u[0], label='u')
    plot(M.t/ms, M.x[0], label='x')
    legend(loc='upper right')
    xlabel('Time (ms)')

figure(figsize=(8, 5), dpi=200)
runit(0, tau=10*ms, tauf=50*ms, taud=750*ms, U=0.45)
runit(1, tau=10*ms, tauf=750*ms, taud=50*ms, U=0.15)
tight_layout();
Coincidence detection
start_scope()
tau = 5*ms
eqs = '''
dv/dt = -v/tau : 1
'''
H = SpikeGeneratorGroup(1, [0, 0, 0, 0], [10*ms, 11*ms, 50*ms, 60*ms])
G = NeuronGroup(1, eqs)
S = Synapses(H, G, on_pre='v += 0.6', method='exact')
S.connect(p=1)
M = StateMonitor(G, 'v', record=True)
run(100*ms)
figure(figsize=(8, 2), dpi=200)
plot(M.t/ms, M.v[0])
axhline(1, ls='--', c='g')
xlabel('Time (ms)')
ylabel('Membrane potential')
yticks([])
tight_layout();

start_scope()

def firing_rate(delta_t, w, N=10000, tau=2*ms, sigma=0.3):
    eqs = '''
    dv/dt = -v/tau + sigma*xi*sqrt(2/tau) : 1
    '''
    H = SpikeGeneratorGroup(2, [0, 1], [150*ms, 150*ms+delta_t])
    G = NeuronGroup(N, eqs, threshold='v>1', reset='v=0', method='euler')
    S = Synapses(H, G, on_pre='v += w')
    M = SpikeMonitor(G)
    S.connect(p=1)
    run(200*ms)
    return mean(M.count)#/(200*ms)

DELTA_T = np.linspace(-10, 10, 41)*ms
FR = np.array([firing_rate(delta_t, w=0.8) for delta_t in DELTA_T])
figure(figsize=(8, 5), dpi=200)
plot(DELTA_T/ms, FR)
title('Spike Time Tuning Curve')
xlabel(r'$\delta t$ (ms)')
ylabel('Mean spike count')
tight_layout();
Bayesian decoder
from matplotlib.cm import plasma
deltat = np.linspace(-2, 2, 100)
width = 1
N = 7
centres = np.linspace(-2, 2, N)
i = 35
figure(figsize=(5, 4), dpi=200)
for centre in centres:
    y = exp(-(centre-deltat)**2/(2*width**2))
    c = plasma((centre+2)/4)
    plt.plot(deltat, y, c=c)
    plt.plot(deltat[i], y[i], 'o', c=c)
plt.axvline(deltat[i], ls='--', c='gray', zorder=-1)
xlabel(r'$\delta t$ (ms)')
ylabel('Activity')
title('Population')
yticks([])
tight_layout();