Introduction
In the last section we covered how neurons signal and synapse with each other.
Circuit mapping
To do this, we will go through two examples of networks found in biology.
But first, how do neuroscientists map biological circuits?
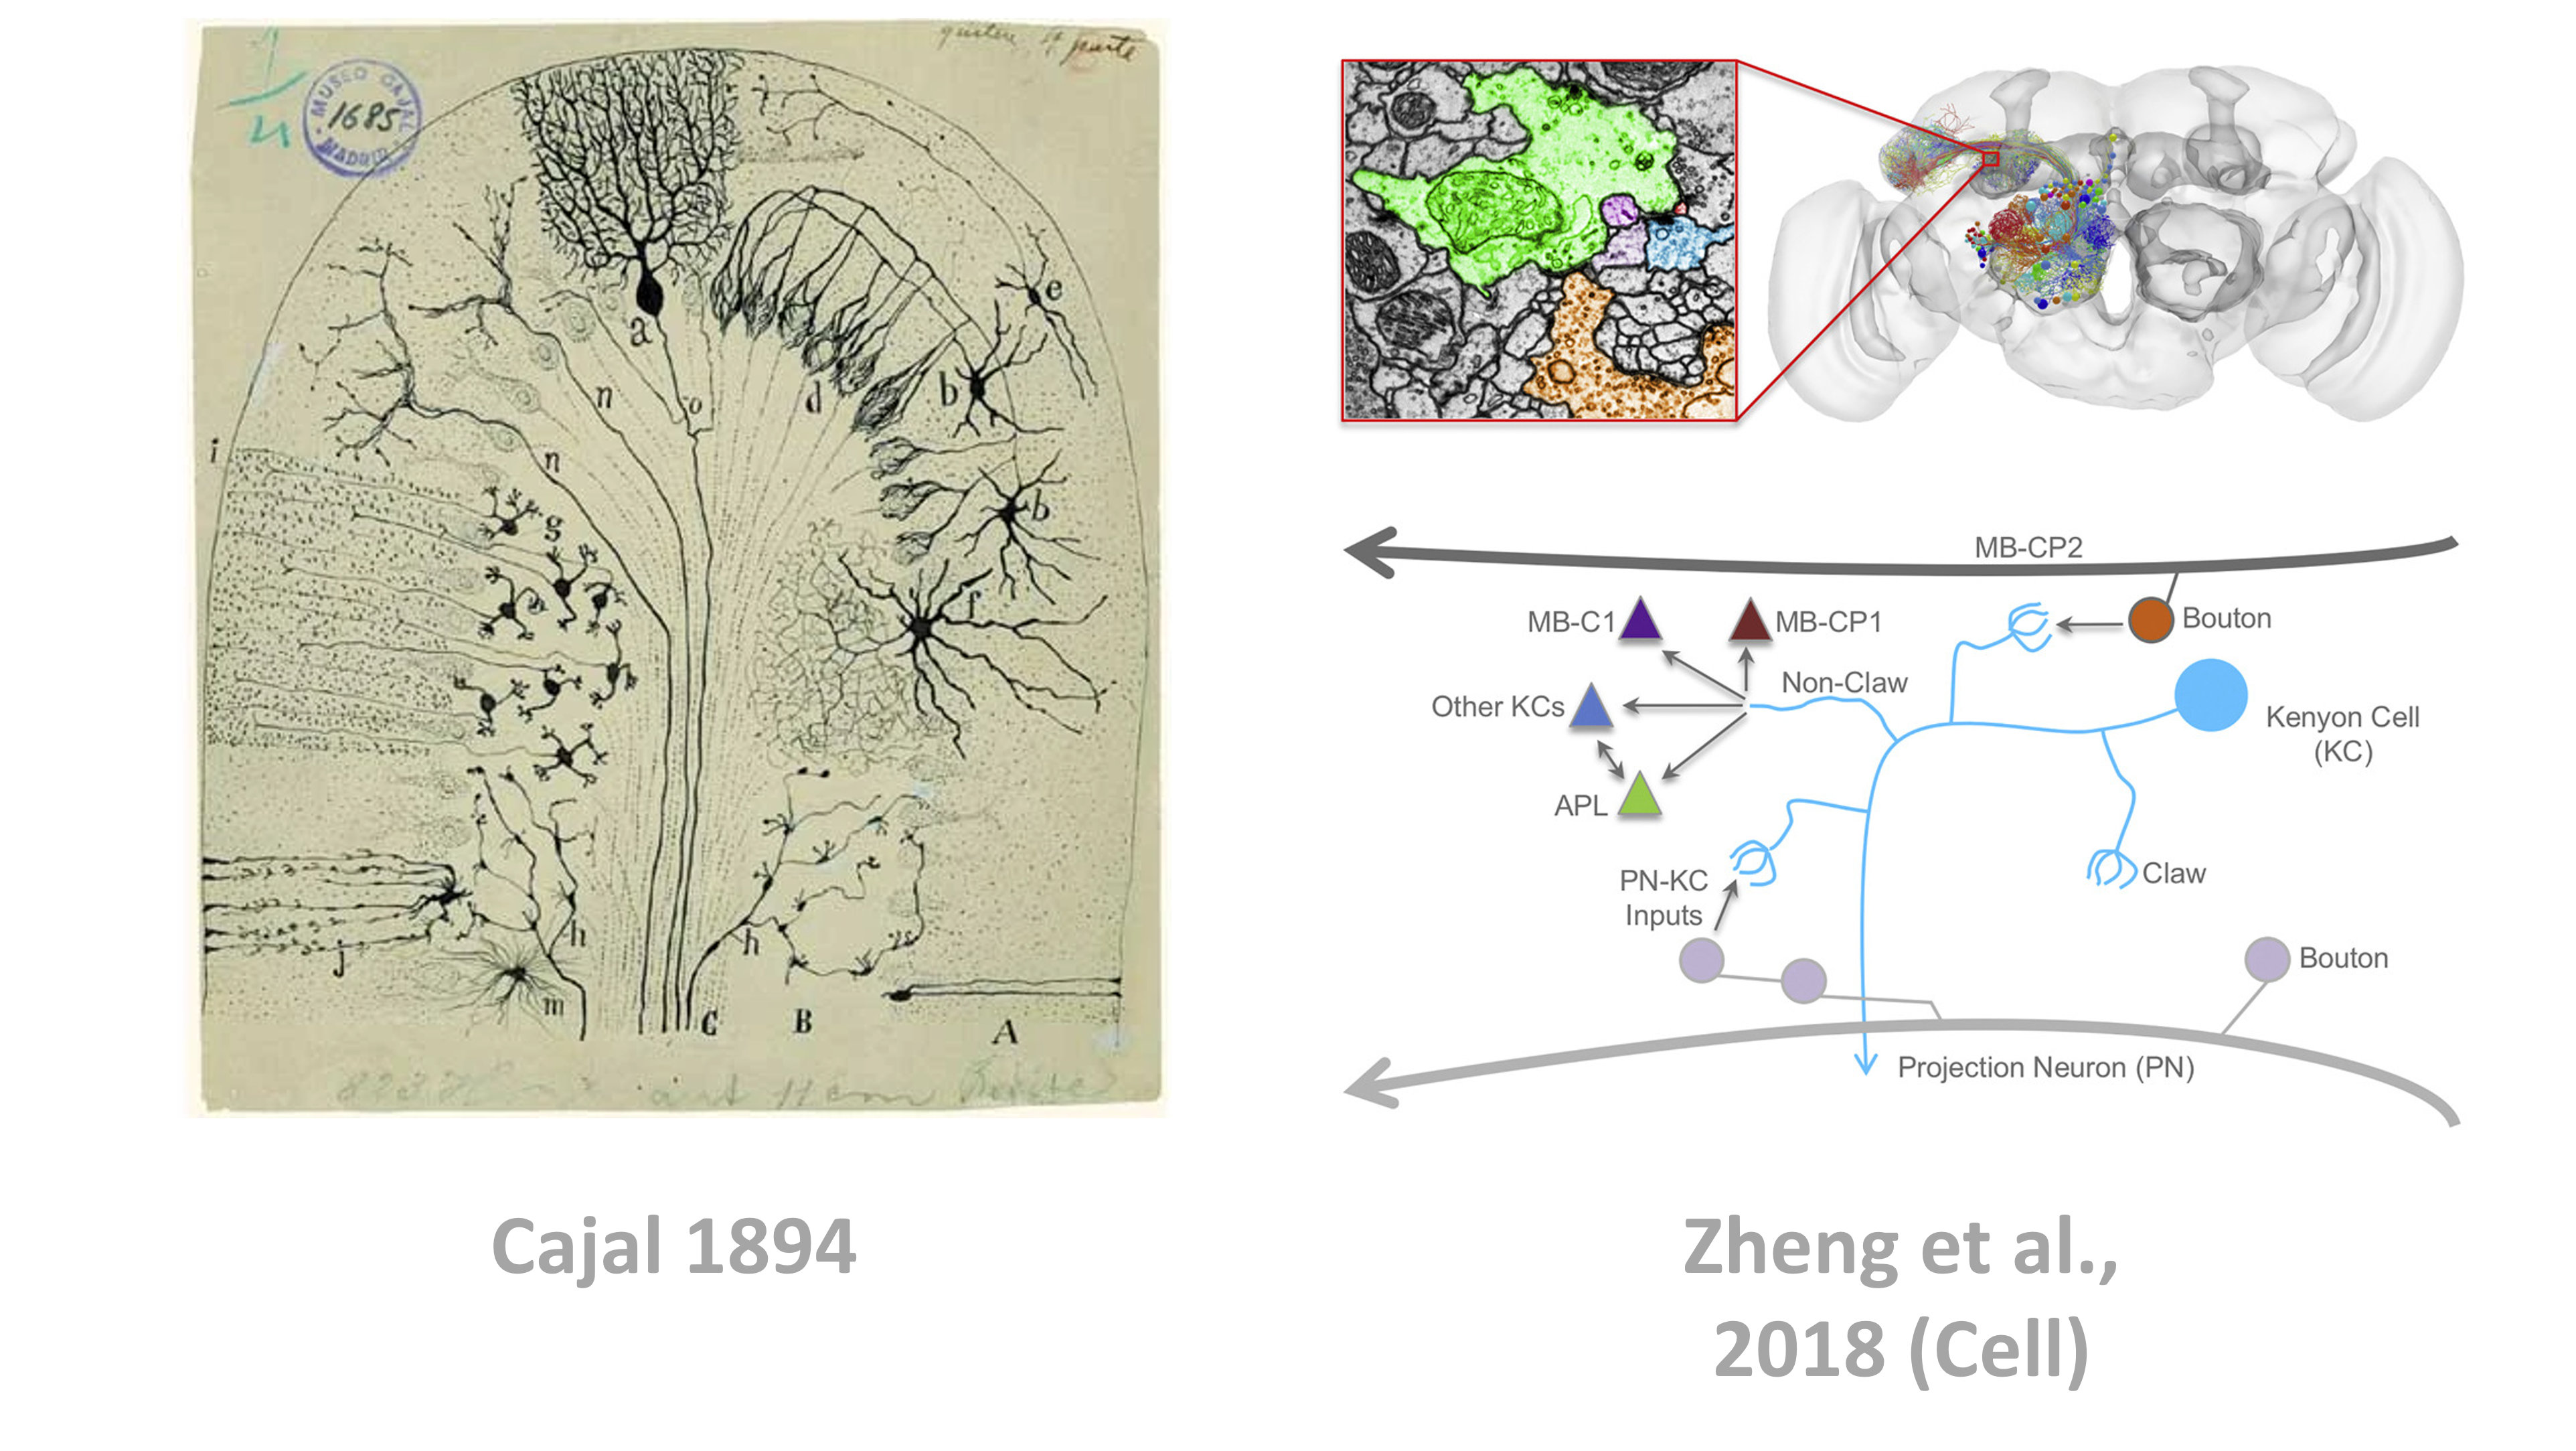
Biological circuit mapping is essentially done by dissecting an animal’s brain, slicing it very thinly, staining it, viewing it under a microscope and then analyzing the images. Historically this was all done by hand, like the drawings from Cajal in 1894 shown below, but everything from the data acquisition to the analysis is now being automated.

Figure 1:Circuit mapping has traditionally been done by hand (e.g. Cajal - left), but is increasingly automated (as in Zheng et al., 2018 - right).
The cerebellum
The cerebellum is an area of the brain involved in coordinating movement, and is composed of circuits which look something like this diagram:
There are 3 points to note here:
- The cells are found in three layers, which are labelled on the left of the image.
- The major cell types are labelled, like the Granule and Purkinje cells.
- The connections between the different cell types are marked as either excitatory or inhibitory, depending on what neurotransmitters they use.
So how does information flow through this network?
In the mossy fiber pathway (on the right of the image) inputs synapse with granule cells. These then send their outputs up into the layer above where they branch out and spread through the Purkinje cell dendritic arbours, forming thousands of excitatory synapses. Because of their structure, these granule cell outputs are known as parallel fibres. The Purkinje cells then send inhibitory connections to the circuit’s outputs - the deep cerebeller nuclei. In a second pathway (on the left of the image), the climbing fibre pathway, other inputs skip straight to the Purkinje cells.
As you can also see from the image, there are other interesting connections in the circuit too, such as the direct connections from both input pathways (the mossy and climbing fibres) to the outputs (the deep cerebellar nuclei).
So how can we think about or model this network’s function?
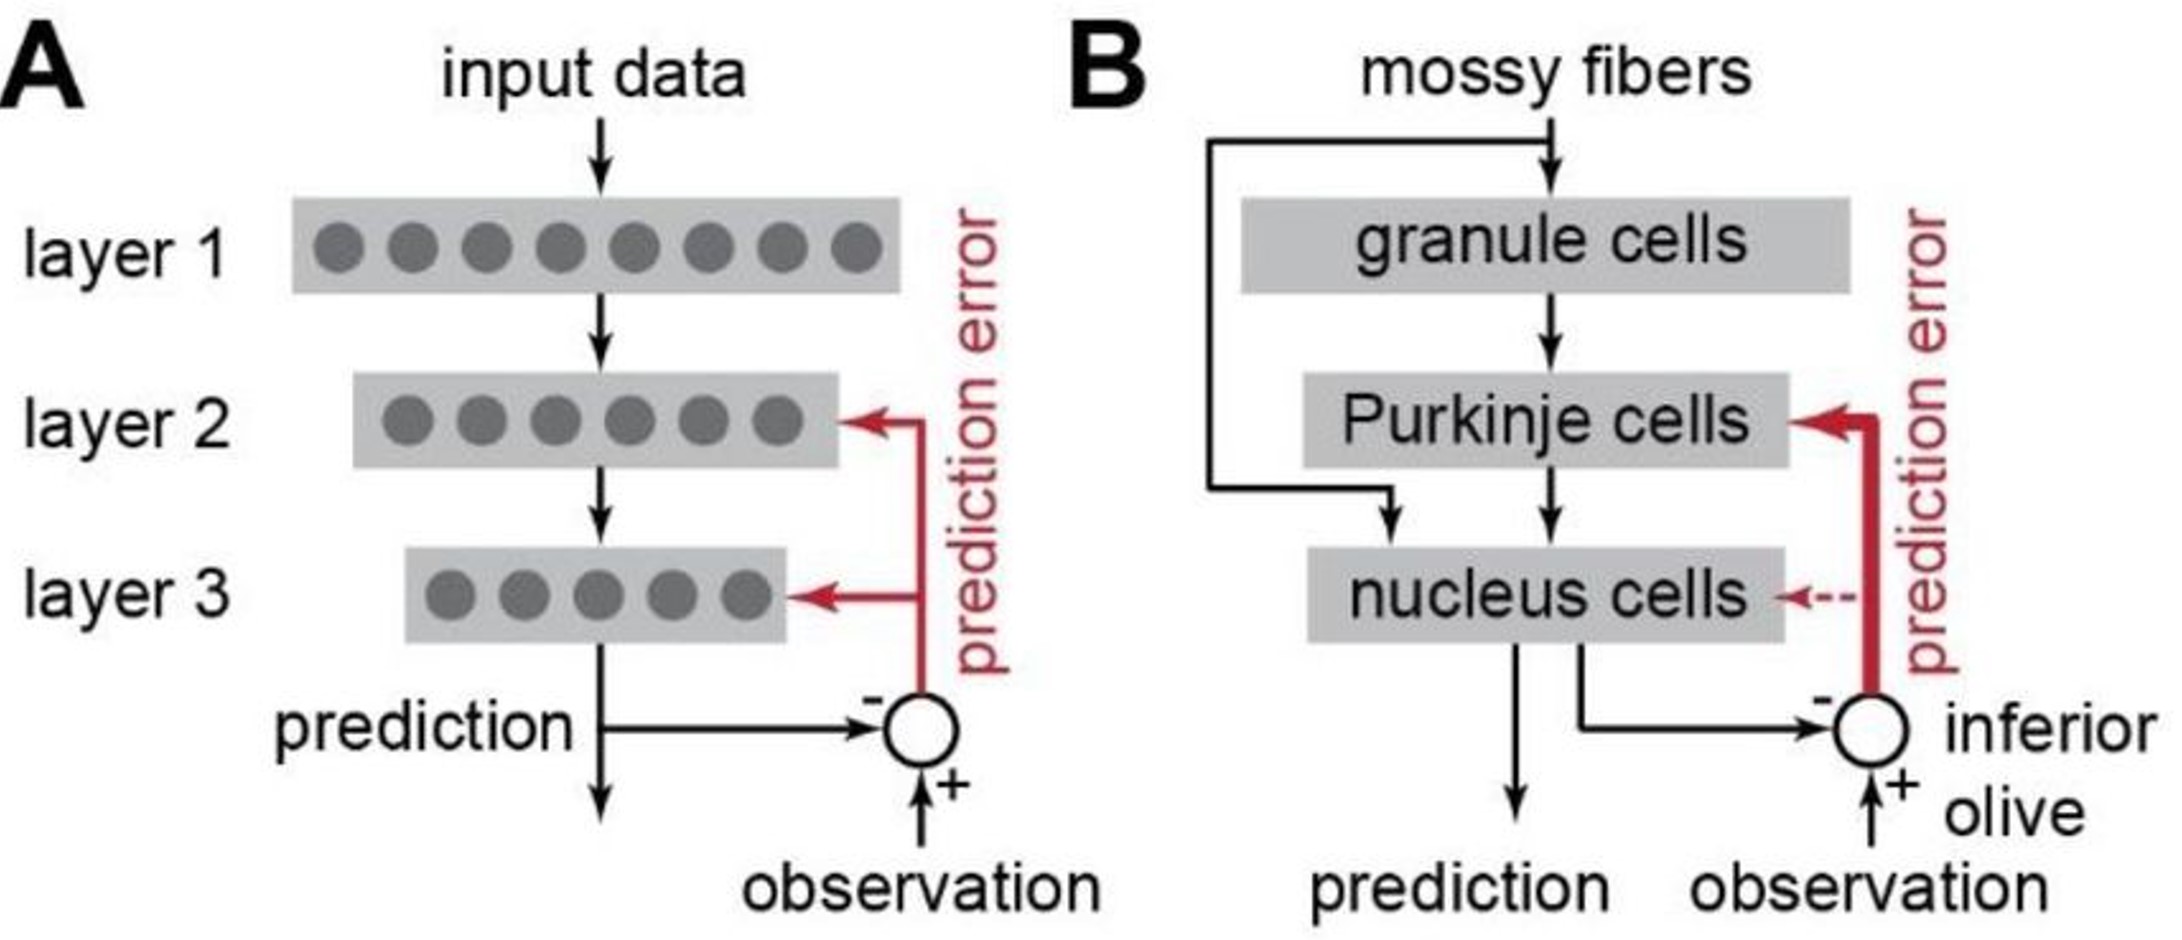
Models have been proposed for over 50 years, but one simplified way to think about it is as a three-layer network with the two pathways we just discussed. Inputs arrive via the mossy fibers, which connects to both the first and third layers, the granule and nucleus cells. Then there are feedforward connections through network and the third layer generates output predictions. These outputs are then compared to input observations, and the difference between the two is fed back to the network as an error signal, via the climbing fiber pathway (shown in red in the images below).

Figure 3:Model of cerebellar function Shadmehr, 2020.
For more
Shadmehr (2020) focuses on an interesting question, which is how the network can learn, when the connections conveying the error signal to the third layer are relatively weak (shown by thin red arrow).
Head direction cells
Around thirty years ago researchers were recording the activity of individual neurons in a rat brain, when they discovered cells which seemed to encode the animals heading direction, and so named them head direction cells.
Here for example, are three neurons firing rates (in spikes per second) as a function of the animals head direction. You can see that each neuron is very specific.

Figure 4:Neurons “tuned” to head direction Taube et al., 1990.
This and later work would show that, as a population, neurons evenly tile the space of heading directions, and the activity of these cells depends on both visual and vestibular (balance) inputs.
Ring attractors
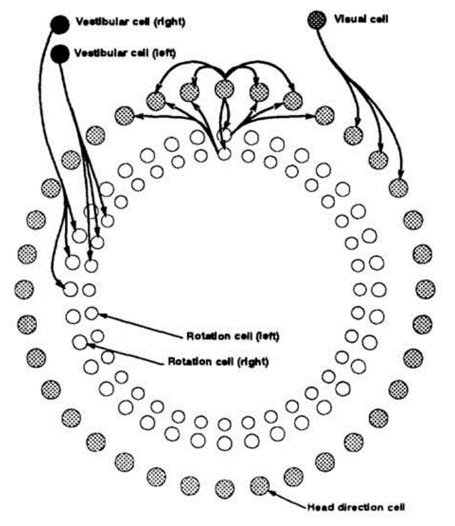
One team proposed an attractor model in 1995, which they drew as a series of rings, with the head direction cells in the outer ring, and visual and vestibular inputs in the inner rings.

A ring attractor model for heading direction (Skaggs et al. 1995).
There are lots of details, but the most salient one is that there are strong excitatory connections between neighbouring head direction cells, and strong inhibitory connections between distant cells. This means that there will be just one cluster of active cells at any time, and either visual or vestibular inputs to the head direction cells will cause the peak to shift around the ring.
Interestingly they thought of this as a somewhat abstract model, and wrote:
“It is helpful to think of the network as a set of circular layers; this does not reflect the anatomical organization of the corresponding cells in the brain”
Though recently experiments in fruit-flies revealed a group of neurons arranged in a ring, with a single bump of activity which tracks the fruit-flies heading direction.
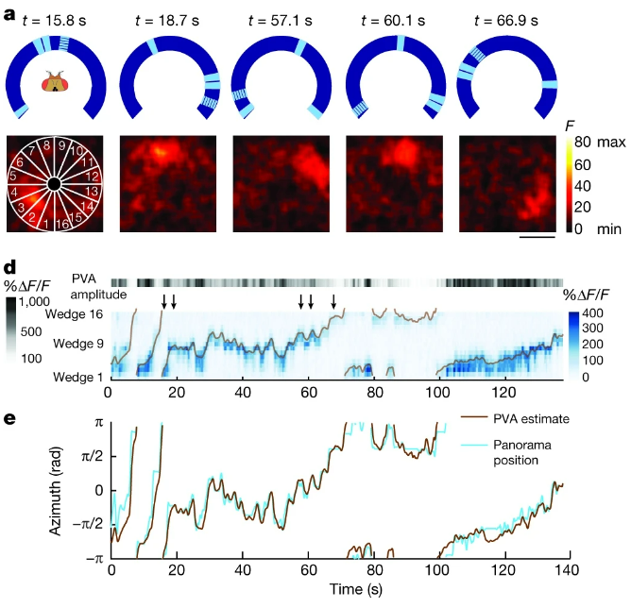
Seelig & Jayaraman (2015) essentially have a fruit-fly walk on a rotating treadmill while the fly watches a screen with landmarks on - the blue ring in panel A on the figure below. They’re also recording the fly’s brain activity, which is shown in the black and red boxes below. The recording technique used will be explained later in the course, but for now it’s enough to know that red indicates more neural activity. What you can hopefully see is that there is a single bump of activity, which rotates around the ring as the fly navigates around. The panels below, D and E, show that this bump accurately tracks the flies heading direction.

Figure 6:Evidence for the ring attractor model in fruit flies Seelig & Jayaraman, 2015.
To conclude, ring attractors are a nice example of where experiments and theory came full circle.
- Zheng, Z., Lauritzen, J. S., Perlman, E., Robinson, C. G., Nichols, M., Milkie, D., Torrens, O., Price, J., Fisher, C. B., Sharifi, N., Calle-Schuler, S. A., Kmecova, L., Ali, I. J., Karsh, B., Trautman, E. T., Bogovic, J. A., Hanslovsky, P., Jefferis, G. S. X. E., Kazhdan, M., … Bock, D. D. (2018). A Complete Electron Microscopy Volume of the Brain of Adult Drosophila melanogaster. Cell, 174(3), 730-743.e22. 10.1016/j.cell.2018.06.019
- Shadmehr, R. (2020). Population coding in the cerebellum: a machine learning perspective. Journal of Neurophysiology, 124(6), 2022–2051. 10.1152/jn.00449.2020
- Taube, J., Muller, R., & Ranck, J. (1990). Head-direction cells recorded from the postsubiculum in freely moving rats. I. Description and quantitative analysis. The Journal of Neuroscience, 10(2), 420–435. 10.1523/jneurosci.10-02-00420.1990
- Seelig, J. D., & Jayaraman, V. (2015). Neural dynamics for landmark orientation and angular path integration. Nature, 521(7551), 186–191. 10.1038/nature14446