Introduction
This week we’re going to explore how researchers try to understand neural networks.
Understanding
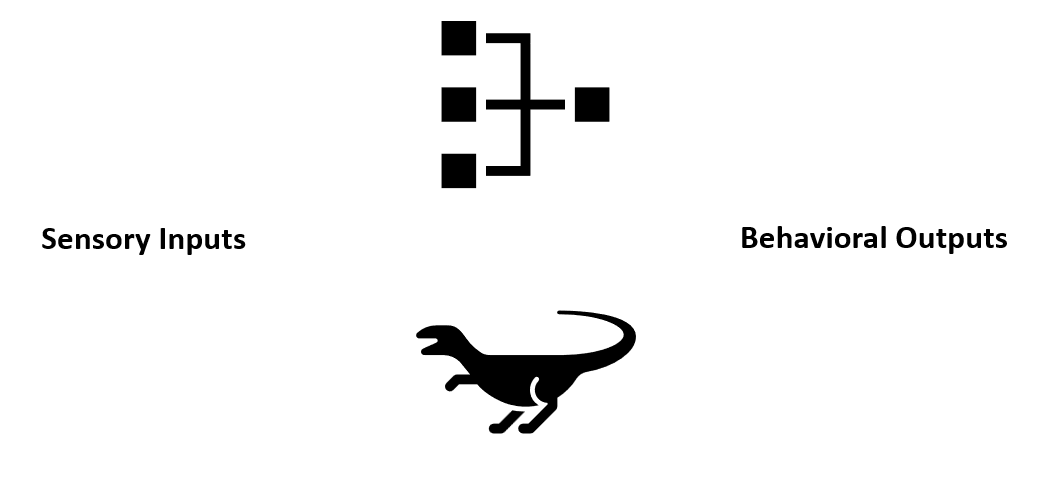
Again, we can think of both artificial neural networks and brains as computing input-output transformations: from sensory stimuli to behavior. But how do all of a networks features; like its unit properties, architecture and activity patterns combine to implement these transformations?
Both neuroscientists and machine learning researchers are interested in this question for a variety of reasons like: using knowledge from biology to improve artificial neural networks or building brain-machine interfaces - which record neural activity and use it to control various devices.
This section will cover three topics related to understanding neural networks - how to:
- Observe neural activity.
- Analyze it.
- Manipulate it.
So how can we observe activity?
In an artificial neural network it’s as simple as running a forward pass through the network and calculating the unit activations.
In a spiking neural network we can pass spikes into the network and record its hidden unit’s membrane voltages or spiking outputs.
But in a biological system we need to choose how we’re going to record neural activity.

Figure 1:The sensorimotor transform.
Recording neural activity
There are different methods for recording neural activity, with different pros and cons, but one way to describe them is on a 2d axis where:
- The x-axis - shows the methods temporal resolution.
- The y-axis - shows the number of neurons the method can record simultaneously.

Figure 2:Different techniques for recording neural activity trade-off temporal resolution (x-axis) and the number of neurons they can record simultaneously (y-axis).
In previous sections we introduced electrophysiology - a technique which lets you record a single neuron with high temporal resolution, so that would sit here on this graph.
To get data from more neurons, with this approach, studies will often record different neurons sequentially over trials and then pool the data over trials and subjects. But even so, you’re often limited to tens to hundreds of neurons and pooling them in this way isn’t ideal.
So how can we record more neurons simultaneously?
Neuropixels
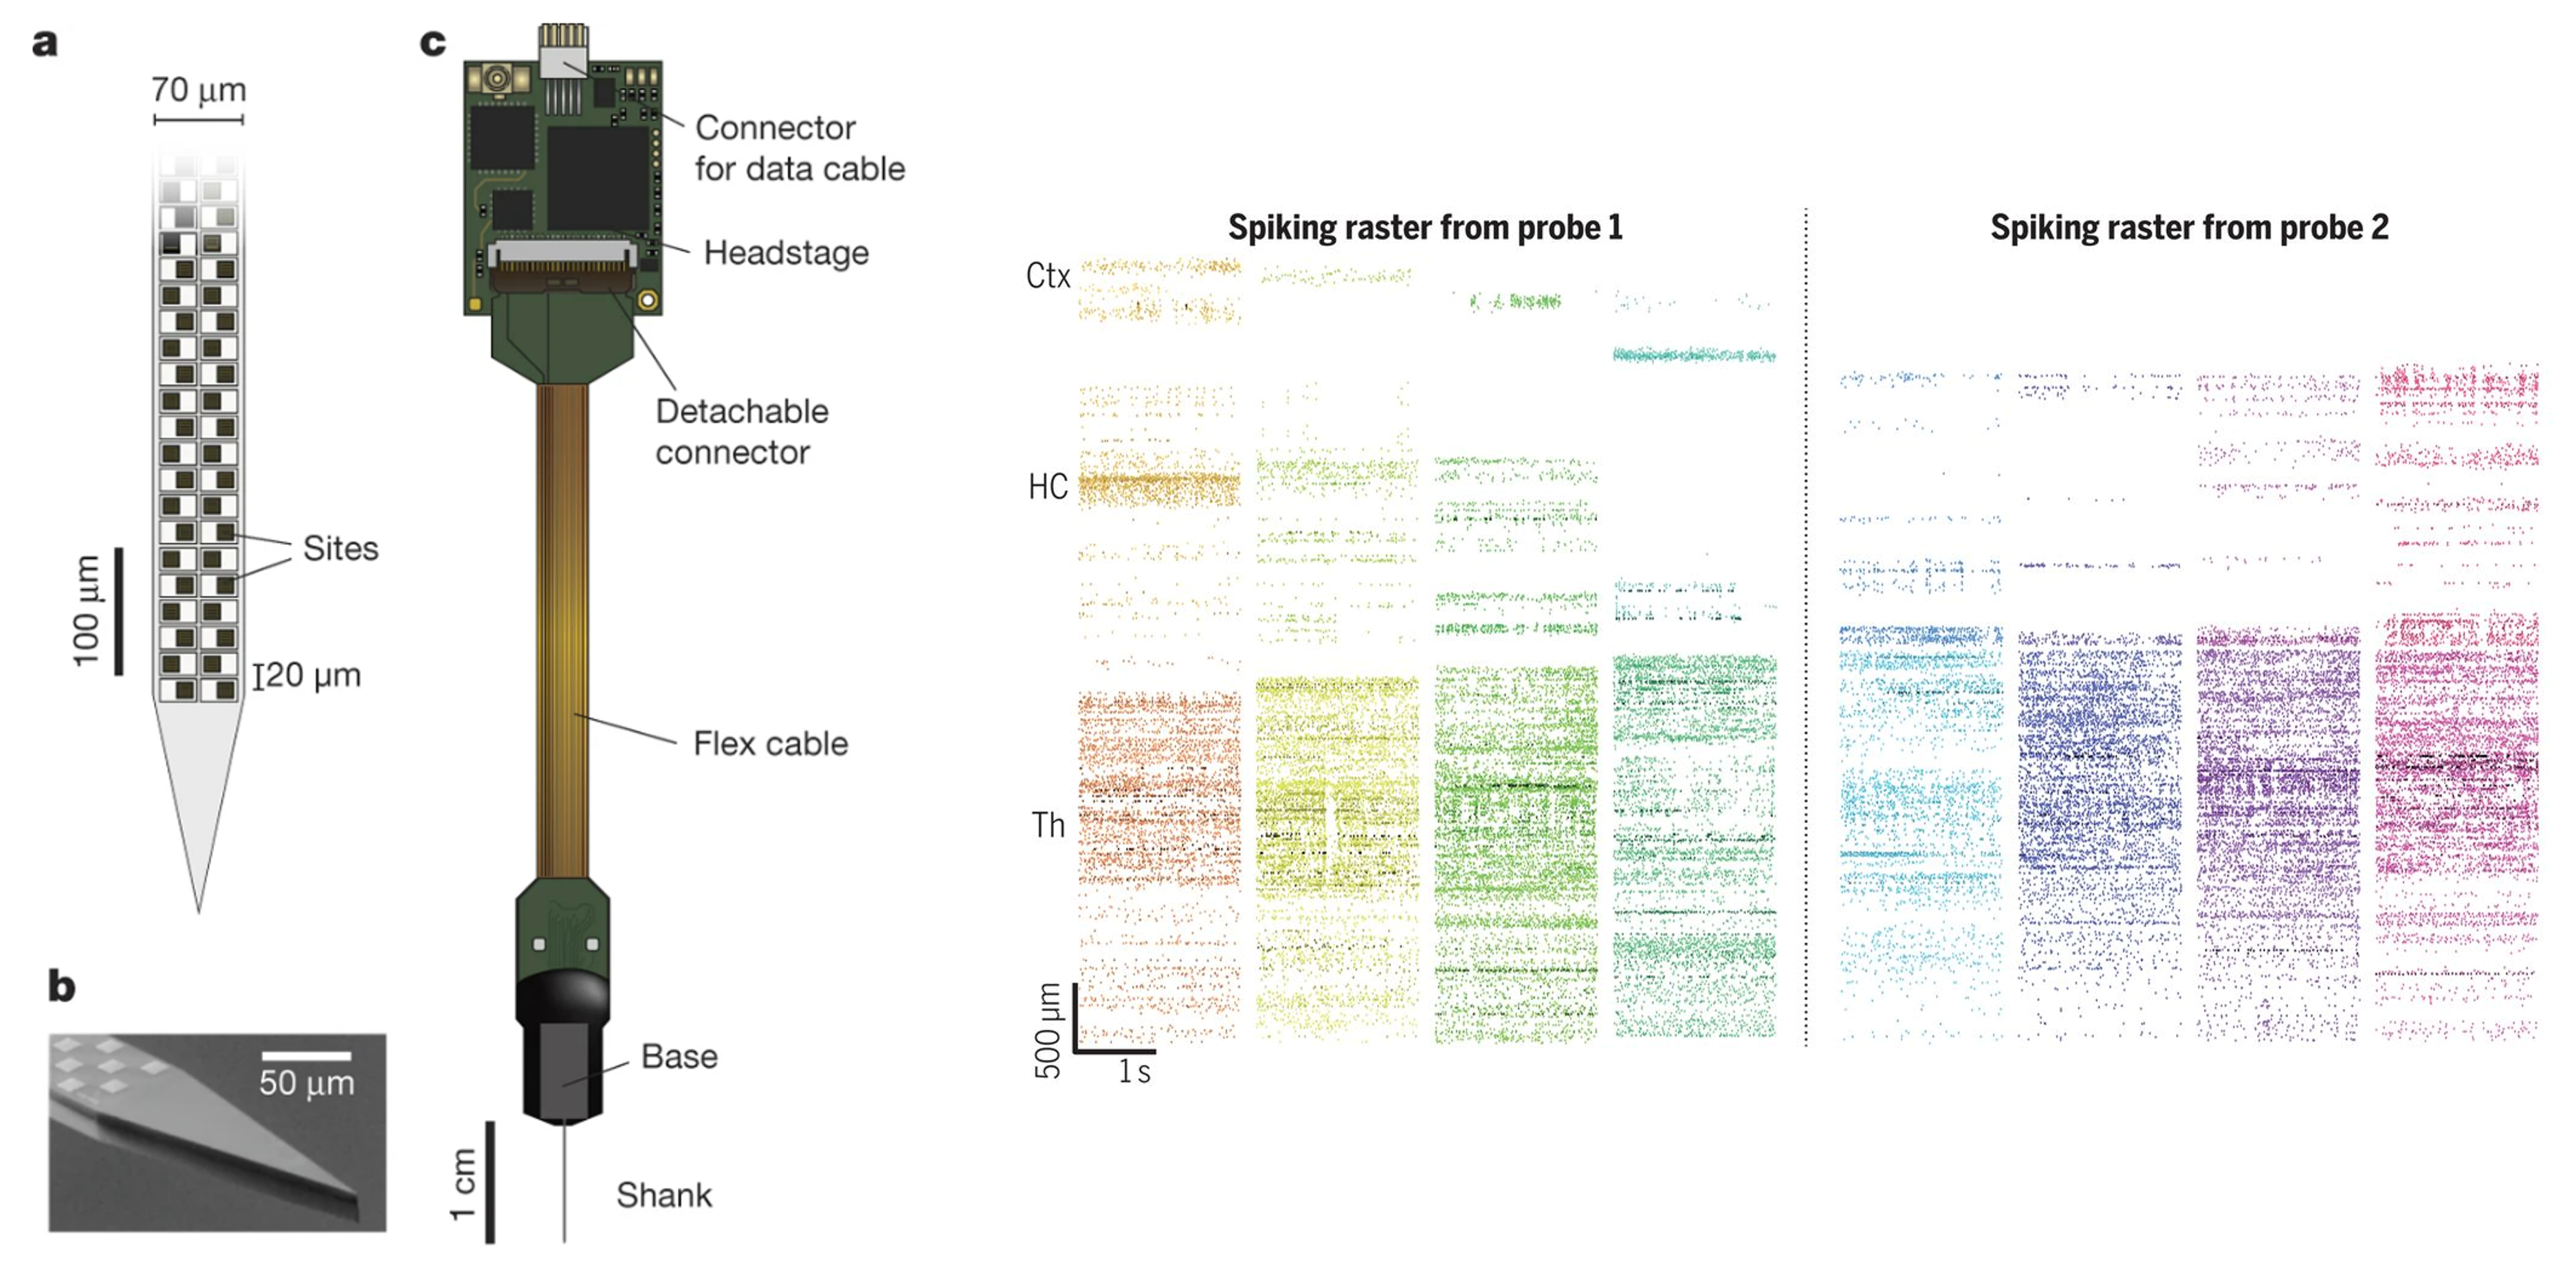
One approach is to use high-density probes, like the Neuropixels probe shown in panel c. The main part of this probe is its extremely thin shank, which is inserted into the brain surgically, and is covered with hundreds of recording sites; which are shown schematically in panel A and in a microscope image in panel B.

Figure 3:High-density probe for simultaneous neuron recording Steinmetz et al., 2021.
These sites record nearby electrical activity, and so each sites’ signal results from the combined activity of many neurons. However, from this data it’s possible to infer the underlying spiking activity of individual neurons, using spike-sorting algorithms which make use of the fact that different neurons have distinct spike shapes.
So, these probes allow you to record from hundreds to thousands of neurons simultaneously. For example, in the raster plots on the right:
- The y-axis shows the recording sites along the shank.
- The x-axis shows time in seconds.
- The coloured blocks show different trials.
These probes represent a huge technological advance. But, it’s worth keeping in mind that they still only let us record from a small fraction of all neurons in the brain. For example, they’re often used in mice which have around 70 million neurons. And even if we can record 1,000 neurons simultaneously, that’s still only around 0.001% of the whole brain.
So how can we get more comprehensive coverage?
Calcium imaging
One alternative is calcium imaging. Remember that when an action potential reaches the axon terminal, it causes voltage-gated calcium channels to open, and calcium to flow into the cell. So we can use changes in calcium concentration to infer neural activity.
Using this approach we can measure neural activity in roughly 4 steps:
- First, we need a calcium indicator - something which changes its fluorescence in the presence of calcium.
- Second, we need to put this indicator inside neurons, and we can do this by injecting them, or by genetically modifying them so that they produce the indicator themselves.
- Third, we need to put our specimen under a microscope and measure each neurons change in fluorescence over time.
- Then finally, we can analyze either the continuous changes in fluorescence or we can infer the underlying spikes using deconvolution algorithms.
The end result of this is shown here in a larval zebrafish. The brain is shown from a top-down (or dorsal view), as well as from the front and side. Brain structure is shown in grey, and then calcium activity is overlaid in red-yellow, and the video is played at about 20 times real-time.
Figure 4:Larval zebrafish brain activity, measured via calcium imaging and shown at 20x real time Ahrens et al., 2013.
While you can use this technique in any animal model, it works particularly well in larval zebrafish as they’re small, and transparent - which, we’re not - so how can we image neural activity in humans?
fMRI
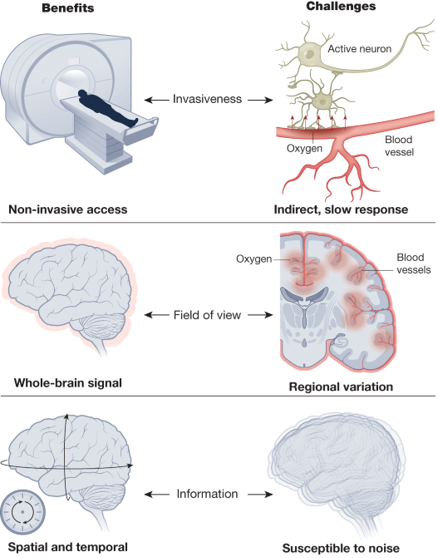
In humans, one of the most commonly used methods is functional magnetic resonance imaging or fMRI: which measures changes in blood flow to regions of the brain. As more active areas require more oxygen, and vice versa, this serves as another proxy for neural activity.
fMRI is widely used as it is:
- Non-invasive - i.e. we don’t need to implant electrodes or inject dyes into subjects.
- It provides whole-brain information.
- It has reasonable spatial and temporal resolution on the order of millimeters and seconds.
Though it is worth keeping in mind that it’s a proxy measure of neural activity, and even though the spatial resolution is on the order of millimeters, each cube or voxel (the smallest measured spatial unit in fMRI) will still contain around 1 million neurons.

Figure 5:fMRI benefits and challenges Finn et al., 2023.
Okay, stepping back a bit, lets approximately map these techniques onto our axis.
Recording neural activity
- High-density probes like Neuropixels have high temporal resolution and can record from hundreds to thousands of neurons.
- Whole-brain calcium imaging has medium temporal resolution, but can record from thousands to tens-of-thousands of neurons.
- fMRI has slow temporal resolution. Though it’s hard to place in terms of number of neurons as it records a whole-brain signal, but can’t resolve individual neurons.

Different techniques for recording neural activity trade-off temporal resolution (x-axis) and the number of neurons they can record simultaneously (y-axis).
Before moving on, there are 2 more things we need to mention.
First, there are many other methods to record neural activity, such as:
- EEG - uses external electrodes to measure the brains electrical activity.
- Voltage imaging - uses indicators whose fluorescence changes with the neuron’s membrane potential. It’s thought that voltage indicators will be the next big thing in neuroscience, and if you’d like to learn more Mark Humpheries has a great blog post on that.
Second, there are lots of other things to consider beyond a methods temporal and spatial resolution. For example, most neural recordings are done on static subjects, fixed under a microscope or lying in a scanner, but there is increasing interest in methods which allow neural activity to be recorded during free movement.
- Steinmetz, N. A., Aydin, C., Lebedeva, A., Okun, M., Pachitariu, M., Bauza, M., Beau, M., Bhagat, J., Böhm, C., Broux, M., Chen, S., Colonell, J., Gardner, R. J., Karsh, B., Kloosterman, F., Kostadinov, D., Mora-Lopez, C., O’Callaghan, J., Park, J., … Harris, T. D. (2021). Neuropixels 2.0: A miniaturized high-density probe for stable, long-term brain recordings. Science, 372(6539). 10.1126/science.abf4588
- Ahrens, M. B., Orger, M. B., Robson, D. N., Li, J. M., & Keller, P. J. (2013). Whole-brain functional imaging at cellular resolution using light-sheet microscopy. Nature Methods, 10(5), 413–420. 10.1038/nmeth.2434
- Finn, E. S., Poldrack, R. A., & Shine, J. M. (2023). Functional neuroimaging as a catalyst for integrated neuroscience. Nature, 623(7986), 263–273. 10.1038/s41586-023-06670-9