Introduction
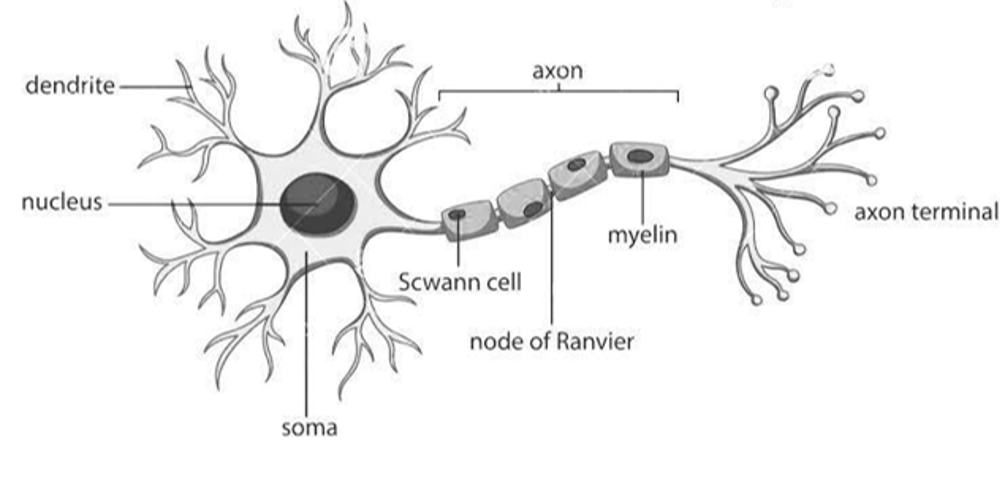
Last week we saw that neurons act as information processing units. To do so, they use both chemical and electrical signals:
- Neurons receive chemical input signals, known as neurotransmitters, at their dendrites.
- Transform this into an electrical signal,
- And then output their own neurotransmitters to other neurons via their axon terminals.

Figure 1:Diagram of neuron.
So let’s start by looking at the electrical activity of a single neuron.
Single neuron recordings
In Figure 2 (from Mensi et al. (2012)) we have time in ms on the x-axis and voltage in mV on the y-axis.
Exactly how researchers acquire this sort of data depends on several factors, but in general you need an electrode, an amplifier, and a specimen to record from, like an isolated neuron in a dish or even a human brain during surgery.

Figure 2:A recording of the activity of a single neuron over time.
From this sort of plot, we can observe two features:
- First, there are these high amplitude, 1-2ms long events, which we call action potentials or spikes.
- Second, between the spikes, the neurons voltage fluctuates around a baseline value, which we call the resting membrane potential.
So, how do neurons generate their resting potential and spikes?
Resting membrane potential
The neuron’s cell membrane plays a key role in generating resting potential and spikes. In Figure 3, the cell membrane separates the inside of the cell from the outside.
Importantly, ions (charged particles), like sodium and potassium are unevenly distributed across the membrane. For example:
- K+ is at higher concentrations inside.
- Na+ and Cl- are at higher concentrations outside.
This means that there are both chemical and electrical gradients across the membrane.

Figure 3:Diagram showing the resting membrane potential and ionic movements.
However, these charged ions can’t cross the membrane directly, and instead must use specialized channels - which are proteins embedded in the membrane.
- Some of these channels are passive - so simply allow ions to diffuse across,
- But others are active and use energy to transports ions against their chemical gradient.
The overall result of these ionic movements, is that each ion balances at an equilibrium: where it’s concentration gradient equals its electrostatic gradient. And this is known as it’s equilibrium or Nernst potential.
Then the resting potential of the membrane is the sum of all of the equilibrium potentials, which is usually somewhere around -70mV.
For more
Check out this video on resting membrane potential
Spikes
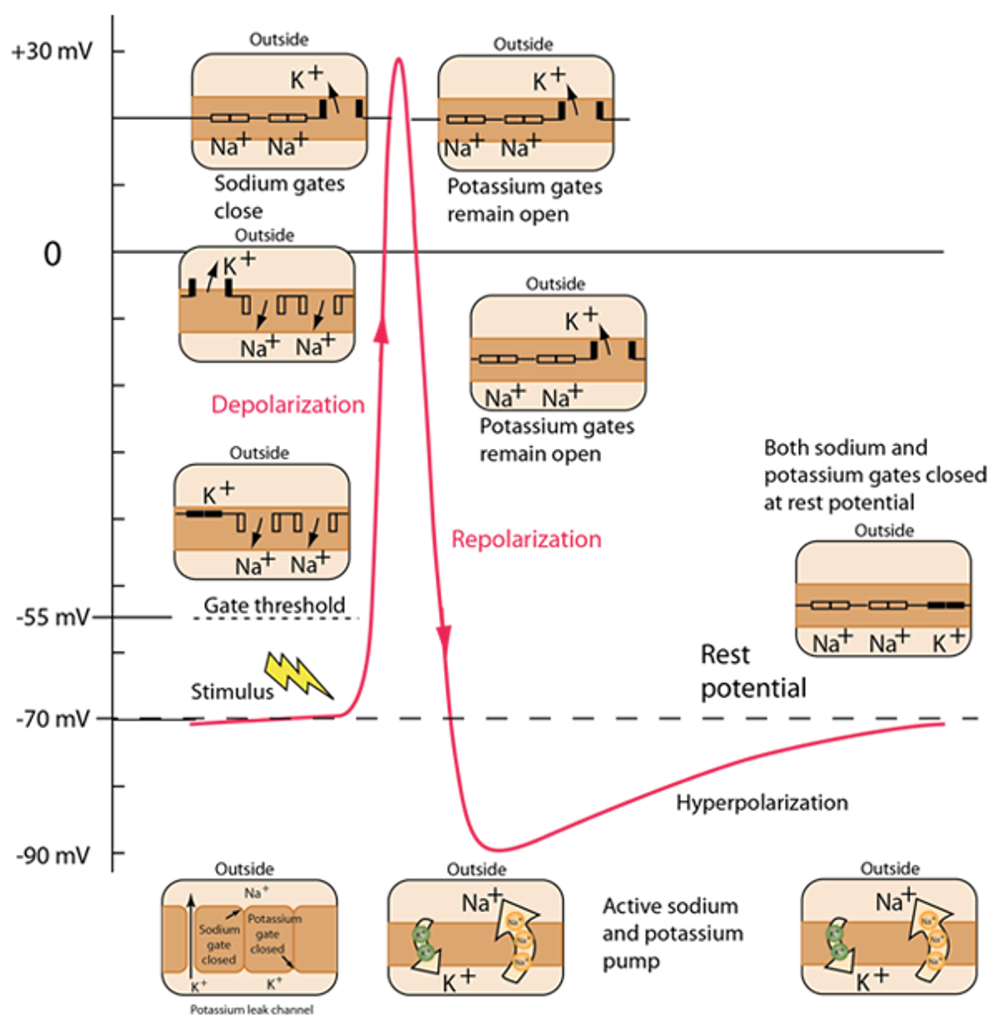
This schematic shows time on the x-axis (on the order of a few ms) and the neuron’s membrane potential on the y-axis in mV.
- Inputs cause Na+ channels, in the membrane, to open and Na+ to flow into the cell down its concentration gradient. This raises the membrane potential, and if it rises high enough (past what is termed the gate threshold), voltage gated Na+ channels open, more Na+ flows in, and the membrane potential rises to its peak. This process is termed depolarisation.
- At high voltages, Na+ channels close.
- But, K+ channels open - and potassium flows out of the neuron, reducing the membrane potential. This is called repolarization.
- Interestingly, repolarization typically goes below the resting membrane potential, here going as low as -90mV. This is called hyperpolarization and it’s effect is to effectively raise the threshold for new stimuli to trigger a spike for a period of time, which we term the refractory period.
- After hyperpolarization, a combination of active and passive ionic movements eventually bring the membrane back to its resting state of -70 mV.

Figure 4:A diagram illustrating action potential generation.
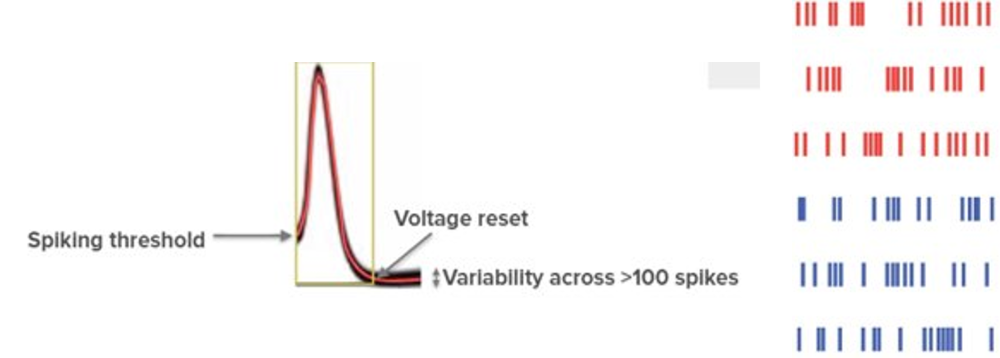
Given the complexity of this process, you may expect that spikes would be noisy, but if we return to our single neuron recording, we see that they are remarkably stereotypical in their shape. Indeed, if we overlay them, we see that the spikes from a given neuron all look alike.
For example see this figure. On the left we see more than 100 spikes recorded from a real neuron, in response to different inputs.
What this means is that each neuron’s spikes are essentially binary, all or nothing responses, and if neurons need to encode more complex information they must do so by varying the number or timing of their spikes. But, we’ll return to how neurons encode information later in the course.
As each neuron’s spikes are so similar, sequences of spikes or spike trains are often plotted as binary events. For example, on the right is what we call a raster plot, and each row shows the spiking activity of a different neuron over time.

Figure 5:As the spikes from a given neuron are so similar (left), they can be plotted as binary events over time (right). Adapted from Mensi et al. (2012).
For more
Check out this video and this website on neuron action potentials.
But, while each neuron’s own spikes share the same shape, not all neurons are alike in their dynamics.
Membrane time constant
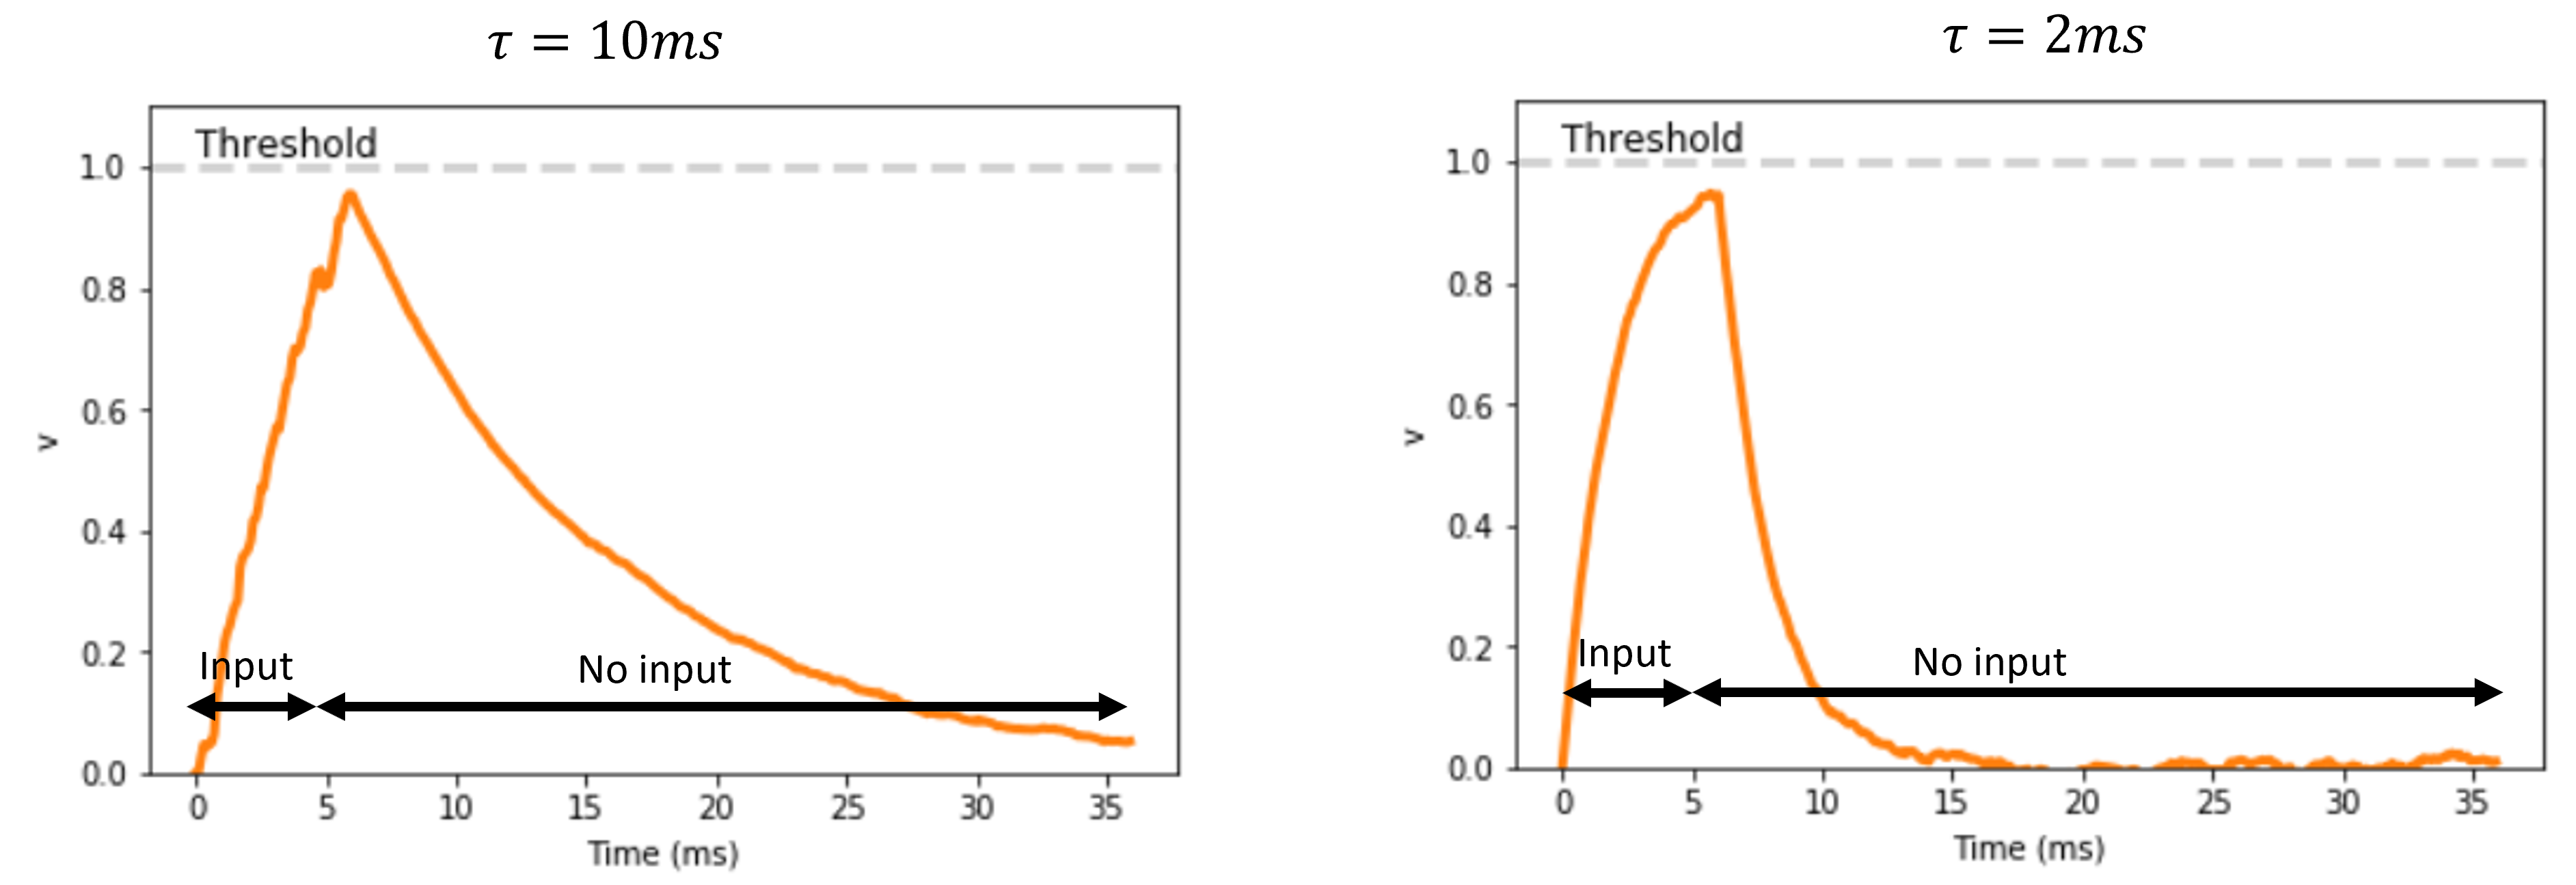
Let’s think about injecting input current into a neuron.
If we inject enough current we’ll raise it’s membrane potential past it’s gate threshold, and cause it to spike.
But if we inject just a small amount of current transiently, then it’s membrane potential will increase and then decay back to rest. We term how long this decay takes, the membrane time constant, and it has been observed experimentally that different neurons differ in this value. So decay at different rates. And that is what is plotted here for two example neurons, though these are simulated.

Figure 6:Simulations showing how neurons with long (left) vs short (right) membrane time constants, decay to rest at different rates.
While this may seem far from machine learning, using neural network models to explore what role these features play in computation, or using biological features to boost performance are both exciting prospects.
Just to give you one example along these lines. In Perez-Nieves et al. (2021), Dan and colleagues built neural networks with heterogenous membrane time constants and showed that this lead to improvements in task performance.
But how do you make artificial units with different membrane time constants?
- Mensi, S., Naud, R., Pozzorini, C., Avermann, M., Petersen, C. C. H., & Gerstner, W. (2012). Parameter extraction and classification of three cortical neuron types reveals two distinct adaptation mechanisms. Journal of Neurophysiology, 107(6), 1756–1775. 10.1152/jn.00408.2011
- Perez-Nieves, N., Leung, V. C. H., Dragotti, P. L., & Goodman, D. F. M. (2021). Neural heterogeneity promotes robust learning. Nature Communications, 12(1). 10.1038/s41467-021-26022-3